Author: David Dehne

  • Time to Revisit Your Constraints

    Time to Revisit Your Constraints


    Constraints management


    We talk a lot about constraints management in our work with customers who are implementing Demand-Driven Manufacturing (DDM) in their facilities. That’s because constraints management is fundamental for synchronizing the pace of production and keeping the demand (orders) flowing throughout the shop floor. But, our focus is naturally on physical constraints, e.g., that piece of equipment or workstation that is preventing you from delivering on time or offering shorter, more competitive lead times to your customers.

    Not Everything is About Production

    Those of you who have spent time studying the Theory of Constraints (TOC) in-depth understand that it’s not always all about the production process. Constraints can fall into one of four categories:

    Four types of constraintsPhysical – These are the constraints we focus on with technologies like CONLOAD that set the pace for production based on the capacity of the physical constraint.

    Policy – These constraints dictate how work is performed. Sometimes you can do something about them (e.g., an old company policy that no longer makes sense), and sometimes you can’t (e.g., a regulation that still might not make sense but needs to be followed anyway).

    Paradigm – This is a way of thinking that gets in the way of meeting commitments, such as the COO’s resistance to outsourcing processes to other companies even if they can do it faster, better or cheaper than you can.

    Market – Put simply, capacity exceeds demand. Remember, TOC emphasizes throughput (The rate at which the system generates “goal units,” Goldratt) and not productivity.

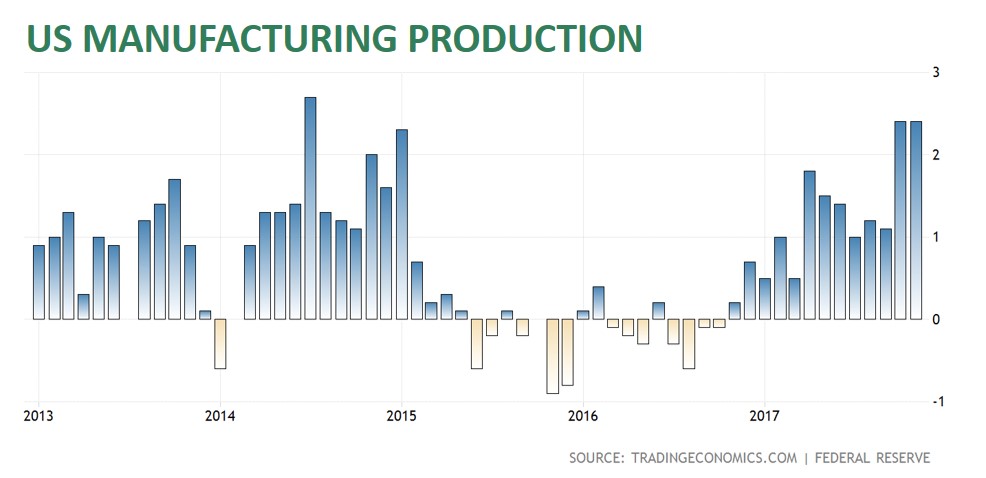
    For some manufacturers, the real constraint over the last decade has been their market. Manufacturing production has seen its share of ups and downs in the last ten years. It wasn’t that our facilities couldn’t produce more, many manufacturers just didn’t have the orders to warrant increased production.

    Shifting Your Paradigms

    Early indications are that many of the market constraints on US manufacturers may be melting away in 2018 through 2020. (Along with a few policy constraints.) Manufacturing GDP is expected to slightly outpace GDP for all industries (2.5%) and grow by 2.8%. (Some analysts are predicting even higher numbers, but like our customers, we prefer to focus on more conservative estimates when doing mid-term forecasting.) The stock market is also at an all-time high, indicating strong investor confidence and more money for investment. Oil prices are expected to remain low, keeping the cost of manufacturing and transportation of goods to market in check.

    U.S. Manufacturing Production Rates

    In other words, it’s time to take your focus off the market constraints you can’t do much about and place it on the constraints that are within your control. If you have outdated policy or paradigm constraints, it’s time to rethink your thinking. If you have physical constraints – leverage them to set the optimal pace for uninterrupted production flow.

    Time flies and so do great economies. Don’t let the best market in a decade pass you by without taking advantage of it. If your constraints are physical, here are a few resources that may help:

    Video: Manage Manufacturing Constraints and Optimize Production Flow with CONLOAD

    White Paper: Metrics That Drive Action

    Case Study: GIW Industries


  • How the Internet of Things Can Help You Lower Inventory Levels

    How the Internet of Things Can Help You Lower Inventory Levels

    How IIoT helps reduce inventory

    McKinsey Global Institute predicts the Industrial Internet of Things (IIoT) will have an economic impact of up to $11 billion by 2025. As much as $3.7 billion of that is expected to come from manufacturing improvements in things like operations management and predictive maintenance.

    The word seems to have gotten out. In a 2016 study conducted by Morgan Stanley and Automation World, 70% of respondents said it was important for their company to adopt an IoT strategy within the next five years. In fact, Morgan Stanley expects IIoT-related CapEx spending to increase from approximately 8% to 185 over the next five years. $3.7 billion projected spend for IIoT

    Predictions like these leave many manufacturers with questions such as: How can the IIoT help my business? How can we get our share of that $3.7 billion pie? If I’m going to increase my CapEx spending on the IIoT, where should I focus those dollars? And, what kind of ROI can I expect?

    In a series of posts, we’re going to focus on IIoT projects that meet several criteria:

    • They don’t require a major overhaul of processes or retooling the factory floor.
    • Capital outlay is often minimal.
    • They support key manufacturing philosophies like Lean, Theory of Constraints, and Six Sigma.
    • The ROI is real and measurable.
    • They can be executed relatively quickly, often providing an ROI in less than two months.

    The High Cost of Excess Inventory

    Lowering costs will probably always be a top goal for manufacturers, so we’re going to begin our series by tackling this challenge. One of the best (but not always the easiest) ways to lower costs is to lower inventory levels. Here’s a quick way to see how much your excess inventory is costing you:

    The commonly accepted carrying cost for inventory is around 20%. (Different industries might have a higher percentage, such as when the inventory requires special handling or is perishable.) If a manufacturer has an annual inventory value of $1 million, lowering that by 10% could save $20,000. If the manufacturer has $100 million in inventory, a 10% reduction in inventory levels could save $2 million. ($100,000,000 * .10 * .20 = $2,000,000)Cost of excess inventory

    There are more complicated ways to calculate the cost of excess inventory. Go ahead and use them if you are comfortable with the math, but this simple calculation works well for most accountants. Regardless of which method you use, the bottom line is always this: Excess inventory is costly!

    But how much of my current inventory is “excess”?

    That question encapsulates the challenge for manufacturing. Manufacturers often feel they need to keep a certain number of weeks’ supply on hand to meet lead times and deal with variability. That may be warranted in some cases, but when we talk to manufacturers about lowering costs, we find that many over-apply this principle by treating all inventory the same way and overestimating how much they actually need to keep on hand to meet service levels.

    Implementing a pull strategy for manufacturing, where inventory replenishment signals are based on consumption, can lower both raw material and WIP inventory levels throughout the enterprise

    Related Resource: White Paper – Gaining Control: Exploring Push v. Pull Manufacturing

    A common way to implement pull-based replenishment signals is to implement Kanban. But, there are a couple of inherent challenges to implementing Kanban manually. The first is that manual Kanban requires workers to do certain things, such as to manage physical Kanban cards which are prone to error or getting lost. The second challenge to manual Kanban is in determining container sizes. How large should they be, and how many should you use?

    eKanban is the IIoT in action

    eKanban can resolve both of those challenges. The signals are electronic, so there isn’t a card that can get lost, damaged, sent to the wrong place, etc. Applications like SyncKanban (the Snynchrono eKanban solution) also responds instantly to changes in demand, resizing containers and adjusting K-loops.70% say IIoT is important

    A K-Loop (Kanban-Loop) is the number of Kanban Cards in the replenishment and usage cycle of an item. The K-Loop is created as a closed loop of activity between all involved in the use and supply of materials.

    eKanban is the IIoT in action, using technology to connect people, data and processes for improved operational performance. But, at the beginning of this post, I promised to focus only on IIoT projects where the ROI is real and measurable. That demands an example:

    Dynisco is a leading manufacturer of materials-testing and extrusion-control instruments, and they take continuous improvement seriously. They implemented a manual Kanban system in several factories but found it was too prone to disruption to help them achieve their goal of a 30% reduction in inventory levels. After replacing the manual system with eKanban software across four factories, they achieved inventory reductions of 51%, 55%, 43% and 29%. The factory that reduced inventory by 55% also reduced lead times from 12 weeks to 2. Read the full case study.

    If you’re ready to reduce inventory levels in your organization, you can schedule a demo of eKanban here or reach out to speak to one of our representatives at info@synchrono.com.

    Related Resources:

    White Paper: Going eKanban: Moving from a manual to an eKanban system

    Brochure: SyncKanban

    Guest Blog: Real-World Advice for Getting Started on eKanban

  • FAQ: Can I Use Demand-Driven Manufacturing in a Make-to-Stock Environment?

    FAQ: Can I Use Demand-Driven Manufacturing in a Make-to-Stock Environment?

    Demand driven manufacturing in MTSDemand-Driven Manufacturing seems like it was made for Make/Assemble-to-Order and Engineer-to-Order environments. It’s true that Demand-Driven Manufacturing can be beneficial for manufacturers who already produce goods based on customer demand because it improves their responsiveness to customers and lowers lead and cycle times.

    Demand-Driven Manufacturing is a method of manufacturing where production is based on actual customer orders (demand) rather than a forecast.

    But what about Make-to-Stock environments? These manufacturers also produce goods based on customer demand, but instead of actual demand, production is typically based on forecasted demand. Considering our definition of Demand-Driven Manufacturing – a method of manufacturing where production is based on actual customer orders rather than a forecast – it seems like that would preclude the Make-to-Stock manufacturer from taking advantage of Demand-Driven Manufacturing principles, right?

    Not at all.

    The challenge in MTS environments is replenishment lead time.

    That is, the lead time provided by the customer is less than the lead time needed to complete the finished good. Given this, MTS Demand-Driven Manufacturers use their forecast to establish a stock buffer. Production execution, however, is based on actual demand. The stock buffer provides just-in-time materials to complete the order, ensuring there are no delays in responding to the demand signal. Here’s how it looks:

    How demand-pull manufacturing works in MTS environments

    MTS manufacturers apply Lean/Demand-Driven strategies to make the stock buffer as small as possible. This reduces carrying costs and the potential for waste. As we’ve covered other posts, eKanban software is a great way to not only reduce lead times, but inventory costs. If considering eKanban, you will want to check out Real-world Advice for Getting Started on eKanban.

    Lower lead times are one of the primary benefits we see in manufacturers who implement components of the Synchrono Demand-Driven Manufacturing Platform (see the sidebar for other benefits). For example, Dynisco, an instrumentation manufacturer, reduced their lead times from 12 weeks to 2. Rex Materials Group reduced their lead times from 3-4 weeks to less than five days in some cases. You can read their case studies and those from several more customers on our website.

    Other ways MTS manufacturers benefit

    As noted in the graphic here, Demand-Driven Manufacturing adds tremendous value to MTS environments in a variety of ways.

    Make to Stock and demand driven manufacturing


    For example, one of the strategies of Demand-Driven Manufacturing is constraints management – adapted from the Theory of Constraints (TOC). According to the TOC, there are a limited number of resources in any manufacturing environment that limits the manufacturer’s ability to meet demand (e.g., the constraint(s)). Scheduling production flow to the capacity of the constraint resource(s) improves overall production flow and on-time delivery rates.

    To show how we work to manage constraints, we’ve posted a short video on YouTube – Manage Manufacturing Constraints and Optimize Production Flow with CONLOAD.

    Here are some additional resources that can help you explore Demand-Driven Manufacturing and what it might mean for your organization. And, as always, reach out to us with any questions you have, or if you’d like to discuss a pilot project.

    Website: Why Demand-Driven Manufacturing?

    White paper: Demand-Driven Manufacturing­—Metrics that Drive Action

    Video: What is Demand-Driven Manufacturing?

    <a href=”http://scapac.aggregage.com/?cmd=best-badge-article&g=87&b=5380&a=7745138&n=4&p=v&s=s&c=” target=”_blank”><img src=”http://scapac.aggregage.com/?cmd=get-best-badge&g=87&b=5380&a=7745138&n=4&p=v&s=s” alt=”Supply Chain APAC Best Article” title=”Supply Chain APAC Best Article” border=”0″ ismap/></a>

  • Thought Leadership: 2018 Top Ten Trends in Modern Demand-Driven Manufacturing

    Thought Leadership: 2018 Top Ten Trends in Modern Demand-Driven Manufacturing

    With all signals pointing toward a good year, manufacturers have a decision to make. They can enjoy the strong economy while it lasts or look to the future and invest in technologies that will help them build a stronger organization that can prosper through economic shifts.

    Last year, the common thread throughout our Top Ten Trends in Modern Demand-Driven Manufacturing list was digitization, synchronization and visualization. This year’s trends revolve around the maturity – and execution – of these concepts.

  • White Paper: The Demand-Driven Supply Chain

    White Paper: The Demand-Driven Supply Chain

    White Paper: The Demand-Driven Supply Chain

    As manufacturing technology evolves, more options become available for managing the increasing complexity of today’s supply chains. This paper provides guidance for evaluating your supply chain processes and how you compare to others on the technology spectrum. Learn why and how more demand-driven manufacturers are establishing a supply chain planning system of record to synchronize activities throughout their supply chain to improve production flow. Real-world examples are provided on how manufacturers are applying technologies to better optimize and visualize their supply chains.

“test”