Author: David Dehne

  • Supply Chain Visibility and Collaboration – How ERP Falls Short


    TR Cutler, Inc. Market Research (TMR) just released the results of a survey conducted in the first two weeks of February, 2017. The respondents were all discrete manufacturers and all held VP or C-level titles. The universe of completed surveys totaled 401 and inquired about the highest priorities for manufacturers today. (The sample size ensures statistical significance to a probability of +/- 3%).

    Key Findings and Frustrationsstreamlining the supply chain is a priority

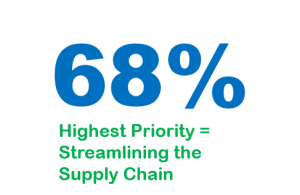
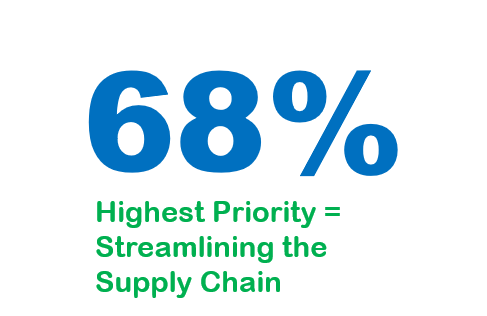
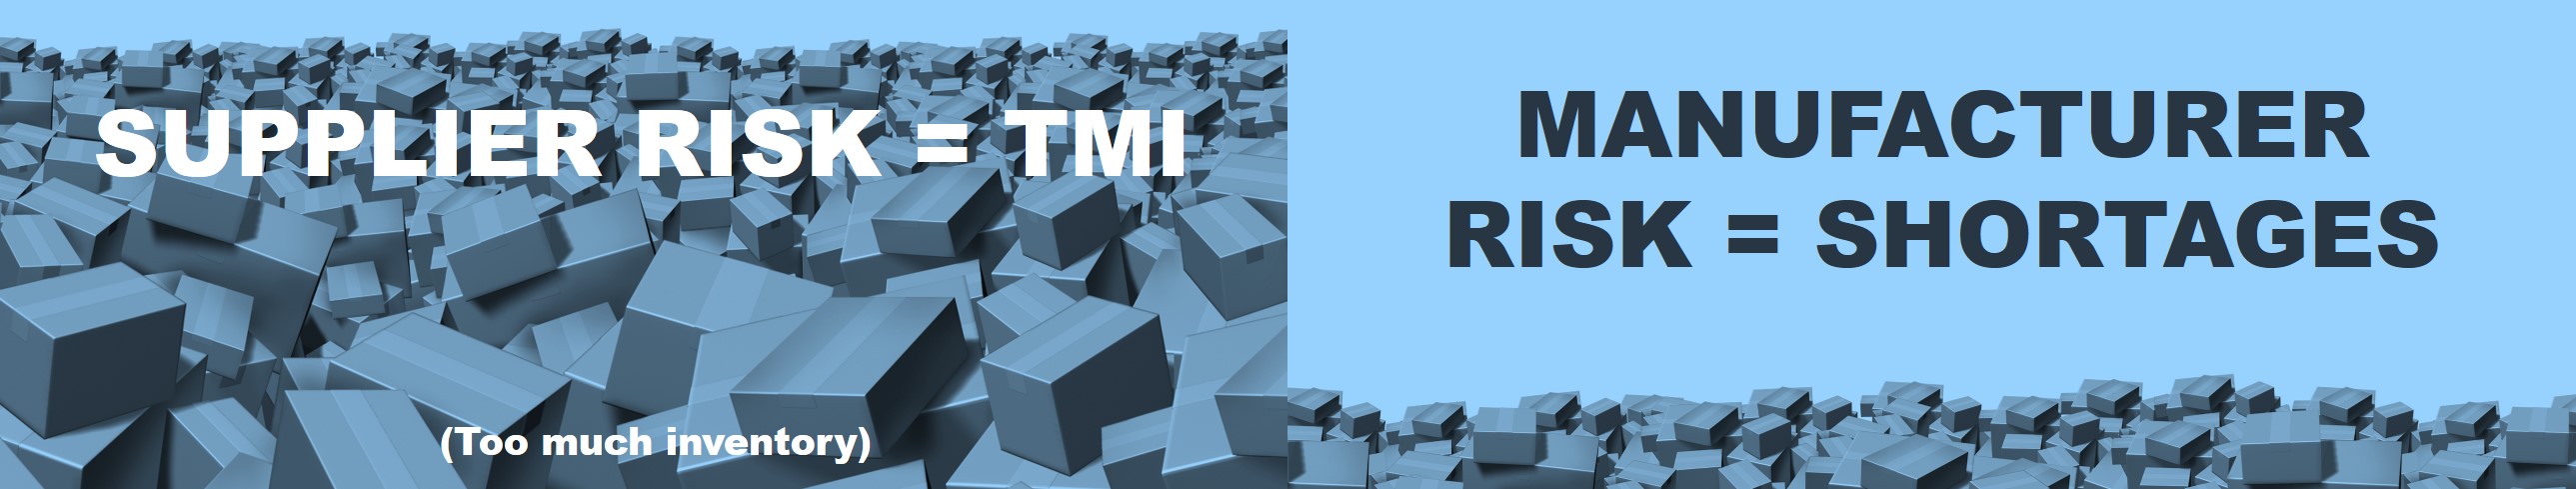
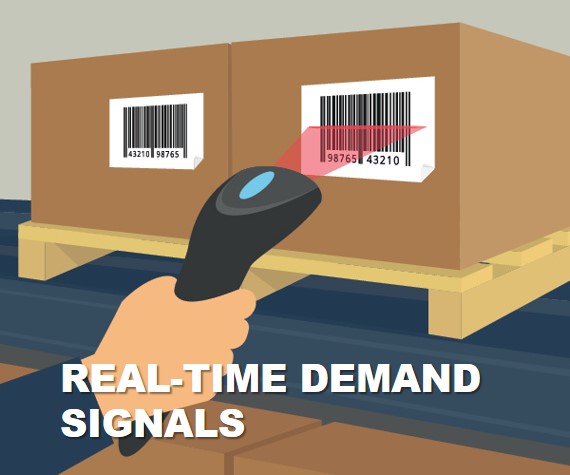
    Unsurprisingly more than two-thirds (68%) of the participants said streamlining the supply chain is the highest priority for discrete manufacturing companies. Purchased parts are typically 60% or more of the manufacturing expense, driving tremendous pressure on materials and supply chain executives to trim costs, while simultaneously improving on-time delivery.

    ERP does not provide visible supply chain data in real-time

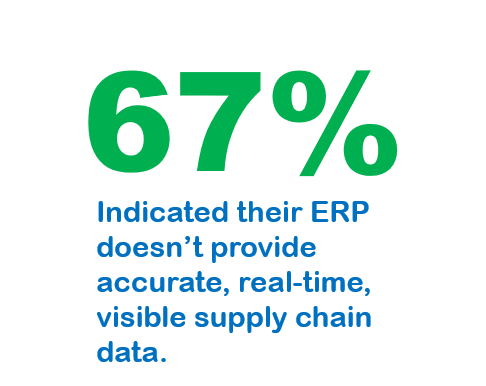
    Interestingly a near identical percentage (67%) said that ERP (enterprise resource planning) solutions fall short of achieving accurate, real-time, visible supply chain data.  This frustration is understandable as most medium and large manufacturing companies have already invested significant capital (both fiscal and human resources) in these ERP systems. ERP systems are capable of managing many business processes within the four walls of their operations, but fall short in providing complete supply chain visibility and collaboration capabilities.

    Because of the prior investment into ERP, most senior manufacturing engineers, plant managers, VP of operations managers, and top supply chain executives, invariably look to their ERP/MRP vendors with whom they have been working for years, to solve the problem. Despite promises of ERP panaceas, none has an ideal solution for supply chain collaboration, supplier visibility, or the ability to access and aggregate voluminous amounts of real-time data from multiple sources.supply chain areas to visualize and streamline

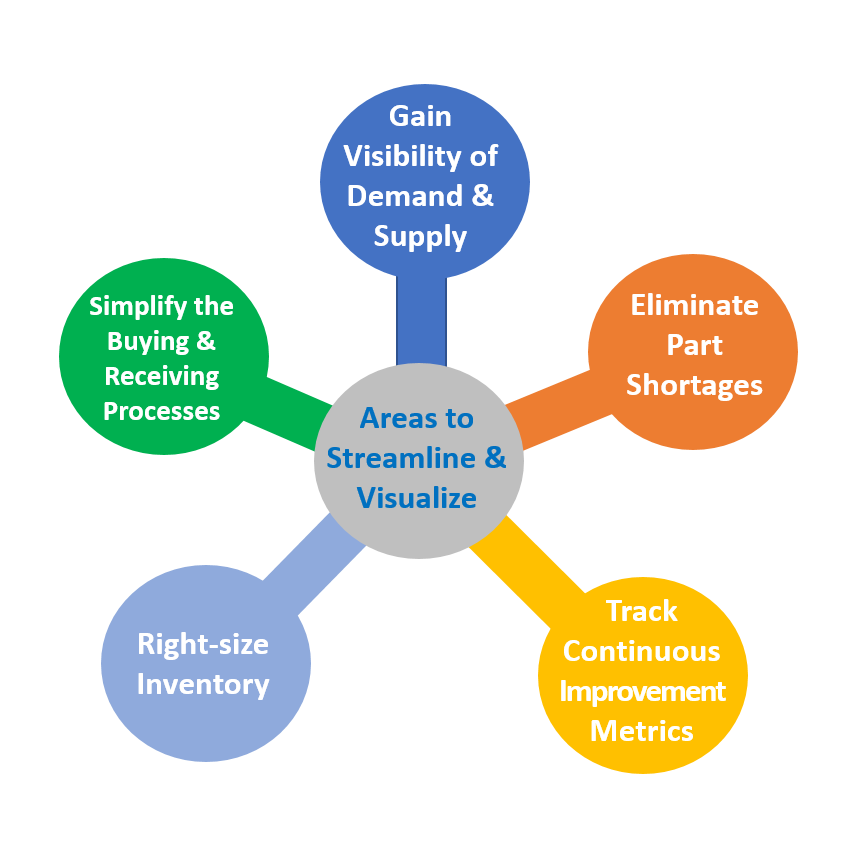
    ERP systems are great for their intended purpose of managing and processing structured transactions. Manufacturing modules in ERP systems, however, do not have the flexibility to manage the real-time variability inherent in most manufacturing environments or the capabilities to support end-to-end production planning, scheduling and execution and associated visibility needs.  Therefore, manufacturers who bought into the promise of holistic ERP solutions are forced to return to planning and scheduling using archaic spreadsheets. To address the market need for end-to-end supply chain visibility and collaboration, manufacturers need a solution that will connect to many data sources, such as logistics, supply chain management, lean production, inventory/warehouses, distribution, and transportation.

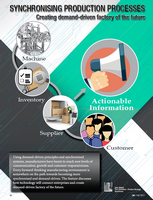
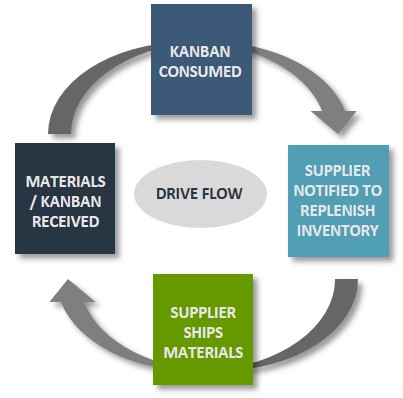
    Synchrono solutions address these market needs.  The company’s demand-driven solutions will work with any ERP system to capture transaction data; allowing manufacturers to maintain their current ERP investment and extend automated, end-to-end solutions to manufacturing operations and the extended supply chain. Synchrono has been facilitating collaboration between manufacturing plants and their global supply base in this way for nearly twenty years.

    Synchrono data allows discrete manufacturers to gain visibility of demand and supply, simplify the buying and receiving processes, reduce inventory, eliminate part shortages, and track continuous improvement metrics. The ability to extend the value of the ERP system with secure, real-time supply chain visibility solutions gives both IT and the business, the tools to be successful.

    Supply Chain Brief Best Article

  • Synchronizing Production Processes

    Synchronizing Production Processes

    Synchronizing Production Processes

    Using demand-driven principles and synchronised systems, manufacturers have learnt to reach new levels of communication, growth and customer responsiveness. Every forward-thinking manufacturing environment is somewhere on the path towards becoming more synchronised and demand-driven. The feature discusses how technology will connect enterprises and create demand-driven factory of the future…MORE

  • Aligning Metrics to Strategy

    Aligning Metrics to Strategy

    Measuring your strategic goals against their value and the time, money and attention they need

    When we began our metrics discussion, we talked about how behaviors are too often dictated by metrics—and whether or not these behaviors actually “move the needle” for sustainable supply chain improvements. Mark Davidson’s blog about aligning metrics to larger goals and objectives covers this topic well. I’d like to go over what I find especially valuable about these tactics. Mark writes: “Largely due to the misalignment of goals and objectives, a considerable number of organizations struggle to realize the full business value that manufacturing can generate.” (e.g., Don’t miss the boat.)

    Let’s talk about the “real-worldAlign manufacturing metrics to strategy” first. We all know that in today’s organizations there are many, competing strategies and objectives.  Look at any strategic plan, and there are many initiatives that cover the gambit of popular business systems, such as CRM, Big Data, Business Intelligence, Cloud Computing, ERP implementations, Supply Chain implementations, Human Resources employee engagement programs, Safety Programs, etc.  There’s no shortage of cost savings and performance enhancing methods to transform organizations.  Yet, without a good way to measure them, they will meet a great deal of resistance.

    Who is driving this thing?

    One of the biggest issues I see is that once strategic objectives are accepted, people start making assumptions.  These assumptions have effects that start to come to light when the tasks and activities are disseminated and the people responsible for implementing the changes start working.  These people are already busy, and now we add new tasks for them to accomplish, often overloading them. If there are multiple strategies to work on among the same teams, then there is a worse problem, as these “difference makers” compete for time, attention, and money.

    Remember, someone has put their butt on the line to drive these strategic objectives.  It seems we all have to have several people in leadership whose job it is to drive these objectives—and the rest of us in an organization have a conflict between the objective’s tasks and our daily workload.

    Getting SMART

    Savvy manufacturers set “SMART” goals—Specific, Measurable, Actionable, Realistic, Time-Based.

    It’s important to understand the interrelationships between high-level goals and objectives as well as what actions or methods are required for an organization to achieve them – this falls under Specific. Measurable and Actionable are when metrics come into play—any desired result must have a set of defined measurements, targets, and actions that can be taken in order to “move the needle” on the metrics that are leading or lagging indicators of results.  

    If an organization is only creating one measurement to support one strategic objective, applying SMART makes sense.

    Beware of too much noise

    The reality is, it’s hard to limit ourselves to one measurement per objective. So, ask yourself, how many new measurements and objectives do you have? Are they all in alignment and driving the desired behavior? The pressure for too many measurements creates dysfunction within the organization. All these initiatives create competition for scarce resources and even more scarce time for change. And, we often find that when you have too many metrics, at some point they may even work against each other. The result is a contentious and noisy organization that struggles to make any sustainable improvements.align metrics with strategy

    That’s why Davidson talks about not only setting KPIs but ensuring that there are processes in place to act on what they reveal. He also insists upon effective communication strategies around the KPIs as well as tying them into the organization’s performance incentives. These are solid ways to ensure that the strategies are not only assigned, but measured, and that the results you achieve really help your organization become more valuable—internally profitable and externally, to become a partner of choice to your customers.

    Every day we work with manufacturers applying demand-driven methods to align all aspects of their operations in order to drive the optimal rate of production flow. This strategy is backed by a specific set of operational metrics these manufacturers measure and take action on for continuous performance improvement.

    Next time- we’ll get more into specific, actionable metrics you’ll need for your demand-driven, lean manufacturing change. Many of the strategies your organization needs to initiate to get the most out of the supply chain function link to becoming more responsive to demand. We’ll figure out how to do that by measuring the right things at the right time for the right results. Read the white paper, Demand-Driven Manufacturing Metrics that Drive Action, to start thinking how you would like to align your metrics to strategy.

    Supply Chain Brief Best Article

  • It’s Time to Revisit Vendor Managed Inventory

    It’s Time to Revisit Vendor Managed Inventory

    VMI and eKanbanA few decades ago, Vendor Managed Inventory (VMI) was a hot topic. Many manufacturers saw it as a way to reduce inventory levels and costs. If they could get their suppliers to maintain ownership of raw materials or subcontracted components until consumed, inventory levels would naturally drop—on paper anyway. Because they were giving most, or all of their business to one supplier, they were also in a position to negotiate better terms. For the supplier, VMI was a win, too, because it allowed them to lock in the manufacturer’s business.

    But VMI came with inherent risks to both the manufacturer and the supplier. On the supplier’s side of the equation, the risk lay in the manufacturer’s ability to forecast demand. Unless the contract between manufacturer and supplier had some sort of “shared responsibility” clause, the manufacturer had no incentive to minimize actual inventory levels. Safety stock and reorder point levels could be set high, with minimal risk. And if the forecast was overstated, the manufacturer didn’t need to worry about excess vendor-managed raw material or contracted-components inventory.

    From the manufacturer’s point of view, the risk lay primarily in the reliability of the supplier. If the supplier didn’t hold up their end of the bargain or a shipment had material defects, the manufacturer risked a material shortage and significant production delays. While these problems could occur with any supplier, one of the visions of VMI was to reduce the headaches that come from managing supplier issues.

    Vendor Managed Inventory (VMI)

    As a result, many manufacturers limited their use of VMI to Class C items that were relatively inexpensive and easily sourced. That way, high safety stock levels didn’t impact their balance sheet much, and supplier reliability issues had a minimal impact on production schedules.

    Demand-Driven Manufacturing Technology Makes VMI Easier

    The technologies our customers use to manage their internal Demand-Driven Manufacturing initiatives have the added benefit of making VMI feasible once again. Electronic Kanban (eKanban) software is a classic example.

    Most readers of this blog are probably familiar with Kanban. They are the automated replenishment signals that are so vital to Lean and Demand-Driven Manufacturing environments. Kanban comes in multiple flavors such as the manufacturing Kanban that signals the need for internal replenishment of materials; the supplier Kanban that initiates replenishment from external suppliers or outsourced manufacturers; and a customer Kanban signals from the customer to the manufacturer for finished goods or replacement parts. Often tugger routes are introduced into the process to deliver materials as needed (regularly or on demand pull) from the warehouse to point of use.

    ekanban demand signals

    The eKanban system enables real-time, electronic signaling. As materials are received into inventory, they are scanned into the system – and, they are scanned again when consumed. Upon consumption of a Kanban, a signal is sent to a supplier or contract manufacturer, bypassing the standard procurement process and shortening cycle times.


    Demand-Driven Manufacturing Reduces the Risk of VMI

    OK, so eKanban can make VMI more functionally feasible and efficient than it was twenty years ago, but what about the risks inherent in VMI?

    That’s where Demand-Driven Manufacturing comes in.

    Technically, implementing Kanban replenishment signals doesn’t automatically qualify your approach as Demand-Driven Manufacturing. You could be in a traditional manufacturing environment using reorder point planning (ROP) to trigger replenishment. For example, your bin sizes are based on ROP calculations that have little to do with actual demand. Since the signal comes from downstream consumption, some would consider this to be pull manufacturing, but it is not in the same way that Lean or Demand Driven environments consider “pull”.  Pull is getting close to the actual demand signal; the more inflated the bin sizes, the further the process is from pull – and the larger the bullwhip the process will create.

    eKanban process

    In true pull-based or Demand-Driven Manufacturing, replenishment is based on actual demand or consumption. (And some buffer stock which we talked about here.) Projected and actual demand, demand variability, and supplier reliability are monitored and inventory is right-sized to meet these specific attributes of the item.  The allows Demand-Driven manufacturers to continually adjust their Kanban Loop sizes so they are always in alignment with demand, supply expectations and actuals.  As variability is removed and lead-times are reduced, the Kanban Loop adjusts to become one step closer to demand.

    Demand-Driven Manufacturing makes VMI far more attractive for your suppliers. They understand that the signals they receive for replenishment aren’t based on some pie-in-the-sky forecast that will leave them sitting on tons of materials in the supply chain that they will eventually have to write off. And, it puts you in a better position to negotiate the kinds of service levels agreements (SLAs) you need to reduce the risks associated with supplier variability.

    If you’d like to learn more about eKanban, here are a few additional resources:

    White Paper: Gaining Control: Exploring Push vs. Pull Manufacturing

    Article: Moving From a Manual to an eKanban System

    Case Study: Continuous Improvement Immersion Plus the Right Tools Proves Profitable for Dynisc


  • Distinctions Between Discrete and Process Manufacturing


    Process manufacturingProcess manufacturing is different, distinct, and distinguishable from discrete manufacturing. Process manufacturing uses formulations versus discrete manufacturers use Bills of Materials (BOMs) and assembles along a routing. Process manufacturers blend a batch – often a literal recipe found in food and beverage manufacturing.

    Discrete manufacturers are typically ETO (engineer-to-order), which includes make-to-stock (MTS), make-to-order (MTO), and assemble-to-order (ATO) production facilities.  Because each product manufacturer is unique, often requiring on-going modifications and engineering during the manufacturing process, there is a strong requirement for synchronized planning, scheduling, execution management and tracking capabilities. Without this alignment and monitoring, operations may degrade and erode profitability.

    Assembly is the cornerstone of discrete manufacturing; it is an exact and precision-focused process. Products are most commonly manufactured in individual production sequence and size, scope, and materials vary widely. In discrete manufacturing production, orders and products change frequently from order to order.

    Process manufacturers build something that cannot be taken apart; once the cake batter ingredients have been mixed, the ingredients cannot be removed from the finished goods produced. This makes process manufacturers formula-focused.

    discrete manufacturingDiscrete manufacturers make finished goods that have components that can be taken apart and used in another capacity. Discrete manufacturing can be reversed, while process manufacturing is irreversible.

    Discrete manufacturing uses complex, layered BOMs while process manufacturing uses multiple recipes and formulas. Process manufacturing looks at shelf life and lot potency. Shelf Life is defined by the Department of Defense (DoD) Shelf Life Management Manual:

    “The total period of time beginning with the date of manufacture, date of cure (for elastomeric and rubber products only), date of assembly, or date of pack (subsistence only), and terminated by the date by which an item must be used (expiration date) or subjected to inspection, test, restoration, or disposal action; or after inspection/laboratory test/restorative action that an item may remain in the combined wholesale (including manufacture’s) and retail storage systems and still be suitable for issue or use by the end user.”

    Discrete manufacturing values serial numbers, assembles, and ECNs. An engineering change notice (ECN), or change notice, is a document which records or authorizes a change to a specific design. Following sound engineering principles, control and documentation are necessary to ensure that changes are built upon a known foundation and approved by relevant authorities.

    An ECN must contain identification of what needs to be changed. This should include the part number and name of the component and reference the drawings that show the component in detail or assembly.

    It must also include the reason(s) for the change as well as a description of the change. This includes a drawing of the component before and after the change. Generally, these drawings only reflect the detail affected by the change.

    ECN’s unique to discrete manufacturers list documents and departments affected by the change. The most important part of making a change is ensuring that all pertinent groups are notified and all documents updated.

    Process manufacturing has the production characteristic which includes few or minimal interruptions in processing within one production run, or between production runs of similar products.

    Discrete engineered-to-order manufacturing includes a high level of customer participation in the design and manufacturing process of the product. Multiple stakeholders and participants work together to make a complex product.  Commonly there are challenges, difficulties, and changes as the product is being manufactured. A troublesome problem in the design phase, often translates to a damaging setback in the manufacturing phase.

    Engineered-to-order mandates that production information and specifications are constantly moving between the ETO company and the customer. Product data including design specifications, requirement files, and engineering changes are as fast as a great racquetball game. Confusion ensues without a clear, concise exchange of product information. The result of failing communication in the ETO discrete space is the thin margin between a profitable or unprofitable project.

    ETO manufacturing types

    Process industries make products in bulk quantities, such as pharmaceuticals, food and beverage, and paints. Discrete manufacturers produce or assemble component or finished products recognized by serial numbers or labeling products and assessable as numerical quantities rather than by weight or volume.

    Do you have any other distinctions you think we should add? If so, drop us a comment!

    Supply Chain Brief Best Article

  • Lean Manufacturing and Continuous Improvement

    Building Muscle for Waste Awareness

    It almost seemed hackneyed: Lean manufacturing and continuous process improvement.  The phrase is tossed about with a certain familiarity and forgone conclusion. Yet this intentional, ongoing process of improving services, and procedures to improve flow, customer satisfaction, quality, safety, and profit means nothing without metrics. A systematic process which identifies and eliminates waste so that ongoing, measurable gains are routinely achieved can only be quantified when the current state and future state are measured.

    Like building muscle sensing, identifying, and being aware of waste is a process. Lean manufacturing teams convert vision statements into specific, actionable measures. Strategies are devised to guide future actions for achieving desired results. I will point to some specific, actionable metrics that can help guide these efforts in a moment, but first let’s review some of the reporting and trending tools used by Lean teams to review process improvement efforts.

    Metrics Reporting System

    Whether required by the CFO to prove fiscal value, or Quality Assurance to attest to improved quality and lower failure rates, all members of a Lean manufacturing operation must demonstrate performance changes over time and compare performance to targets.  This is often expressed as a trend chart.

    Before looking at those trends, working through a comprehensive Value Stream Map (VSM) of the process will clearly illustrate current issues and their relative severity.

    value-stream-mapping-process

    One of the first outcomes of the VSM is often expressed as a Pareto Chart. In the graph below, the bars represent frequency or cost (time or money), and are arranged with longest bars on the left and the shortest to the right. The chart visually depicts which situations are more significant.

    Manufacturing Pareto Chart

    Past is prologue. The phrase comes from Shakespeare’s play The Tempest, where Antonio is trying to convince Sebastian to murder his sleeping father so that Sebastian can be king. His use of the phrase is intended to say to Sebastian that their lives up to this point — their past — was merely a prologue — an introduction — to the great story that they will soon embark upon if they go through with this plan. Used this way, it is meant to imply that everything that came before does not matter because a new and glorious future is ahead.

    Unfortunately, like a lot of phrases coined by Shakespeare, it has since taken on the exact opposite meaning. The way it is commonly used today suggests the past is of great importance because it defines the present and therefore sets the stage for the future. It is in this sense used very similarly to “those who fail to learn the lessons of history are doomed to repeat them.”

    Trend Chart Example - Defects per Unit

    The measurement tool in Lean manufacturing that shows historical trends about waste issues and the relative severity of past issues can be expressed as a Paynter Matrix (example above). It is a matrix of problems, faults, failure types vs. occurrence frequency (days / weeks / months) – named after Marvin Paynter of the Ford Motor Company.

    Improvement must result in a corrective action. Lean manufacturing best-practices require an Action Log (example below), which records actions that have been taken and report the effectiveness of those actions. Monitoring actionable metrics can not only provide the right data points for the Action Log, but can facilitate measurable movement in the right direction.

    Lean Manufacturing Action Log

    Metrics that Drive Action

    At the beginning of this post, I mentioned that Lean teams convert vision statements into specific, actionable measures – and that they devise strategies to guide future actions for achieving desired results. The Demand-Driven Manufacturing Metrics for Action are those actionable measures. They are a proven system of metrics developed based on decades of working with manufacturers on Lean and continuous improvement initiatives. The Metrics for Action are a streamlined set of operational metrics to monitor – and that you can take immediate action on to improve. (They can also identify areas for continuous improvement.)

    Lean metrics for action

    The white paper, Demand-Driven Manufacturing Metrics that Drive Action, describes the foundation for these metrics and the Metrics for Action Guide describes each metric, how to measure it, and provides suggested actions for improvement.

    If you have used these metrics, please share any insight – or value – they provided in your organization.

    Supply Chain Brief Best Article

“test”