Manufacturing Analytics Software
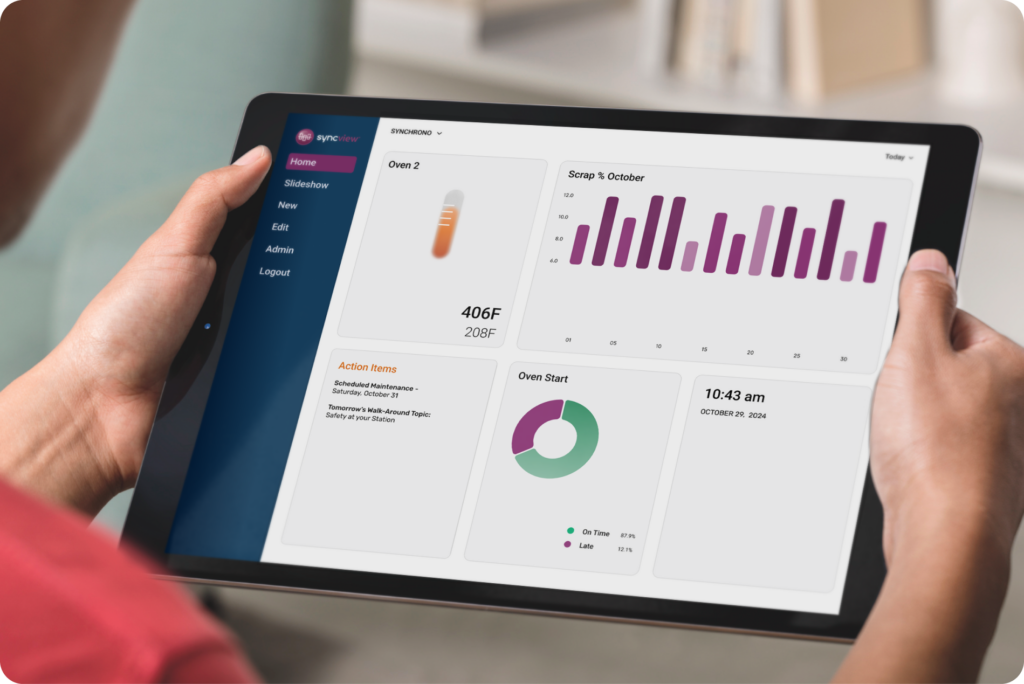
SyncView is a powerful, real-time visualization and communication tool that keeps everyone connected and informed. It enables seamless monitoring of equipment and shop floor status as it happens—anytime, anywhere.
Efficiency Metrics
Measure how effectively resources and time are utilized in the production process. Gain insights into areas for optimization and minimize waste.
Quality Metrics
Monitor how well products meet specifications and track the frequency of defects. Uphold high-quality standards and lower time spent on rework.
Performance Metrics
Analyze the efficiency and effectiveness of manufacturing processes in achieving production goals. Identify areas of improvement across the organization.
Safety Metrics
Gain insights into workplace safety performance and monitor the frequency of incidents and identify potential risks.
Maintenance Metrics
Keep tabs on machinery and equipment performance. Identify issues, prevent unplanned downtime, and extend the lifespan of assets.
OEE Metrics
Proactively identify resources that need attention by tracking Overall Equipment Effectiveness (OEE) metrics across the manufacturing floor.
“It’s a simple thing, but it’s really helpful for everyone to know the status of the day’s orders in real time. Even our inspectors love it because they know what will be coming over to them.”
Lonnie Kunze, Master Scheduler | Johnstech
Seamless Integration and Scalability
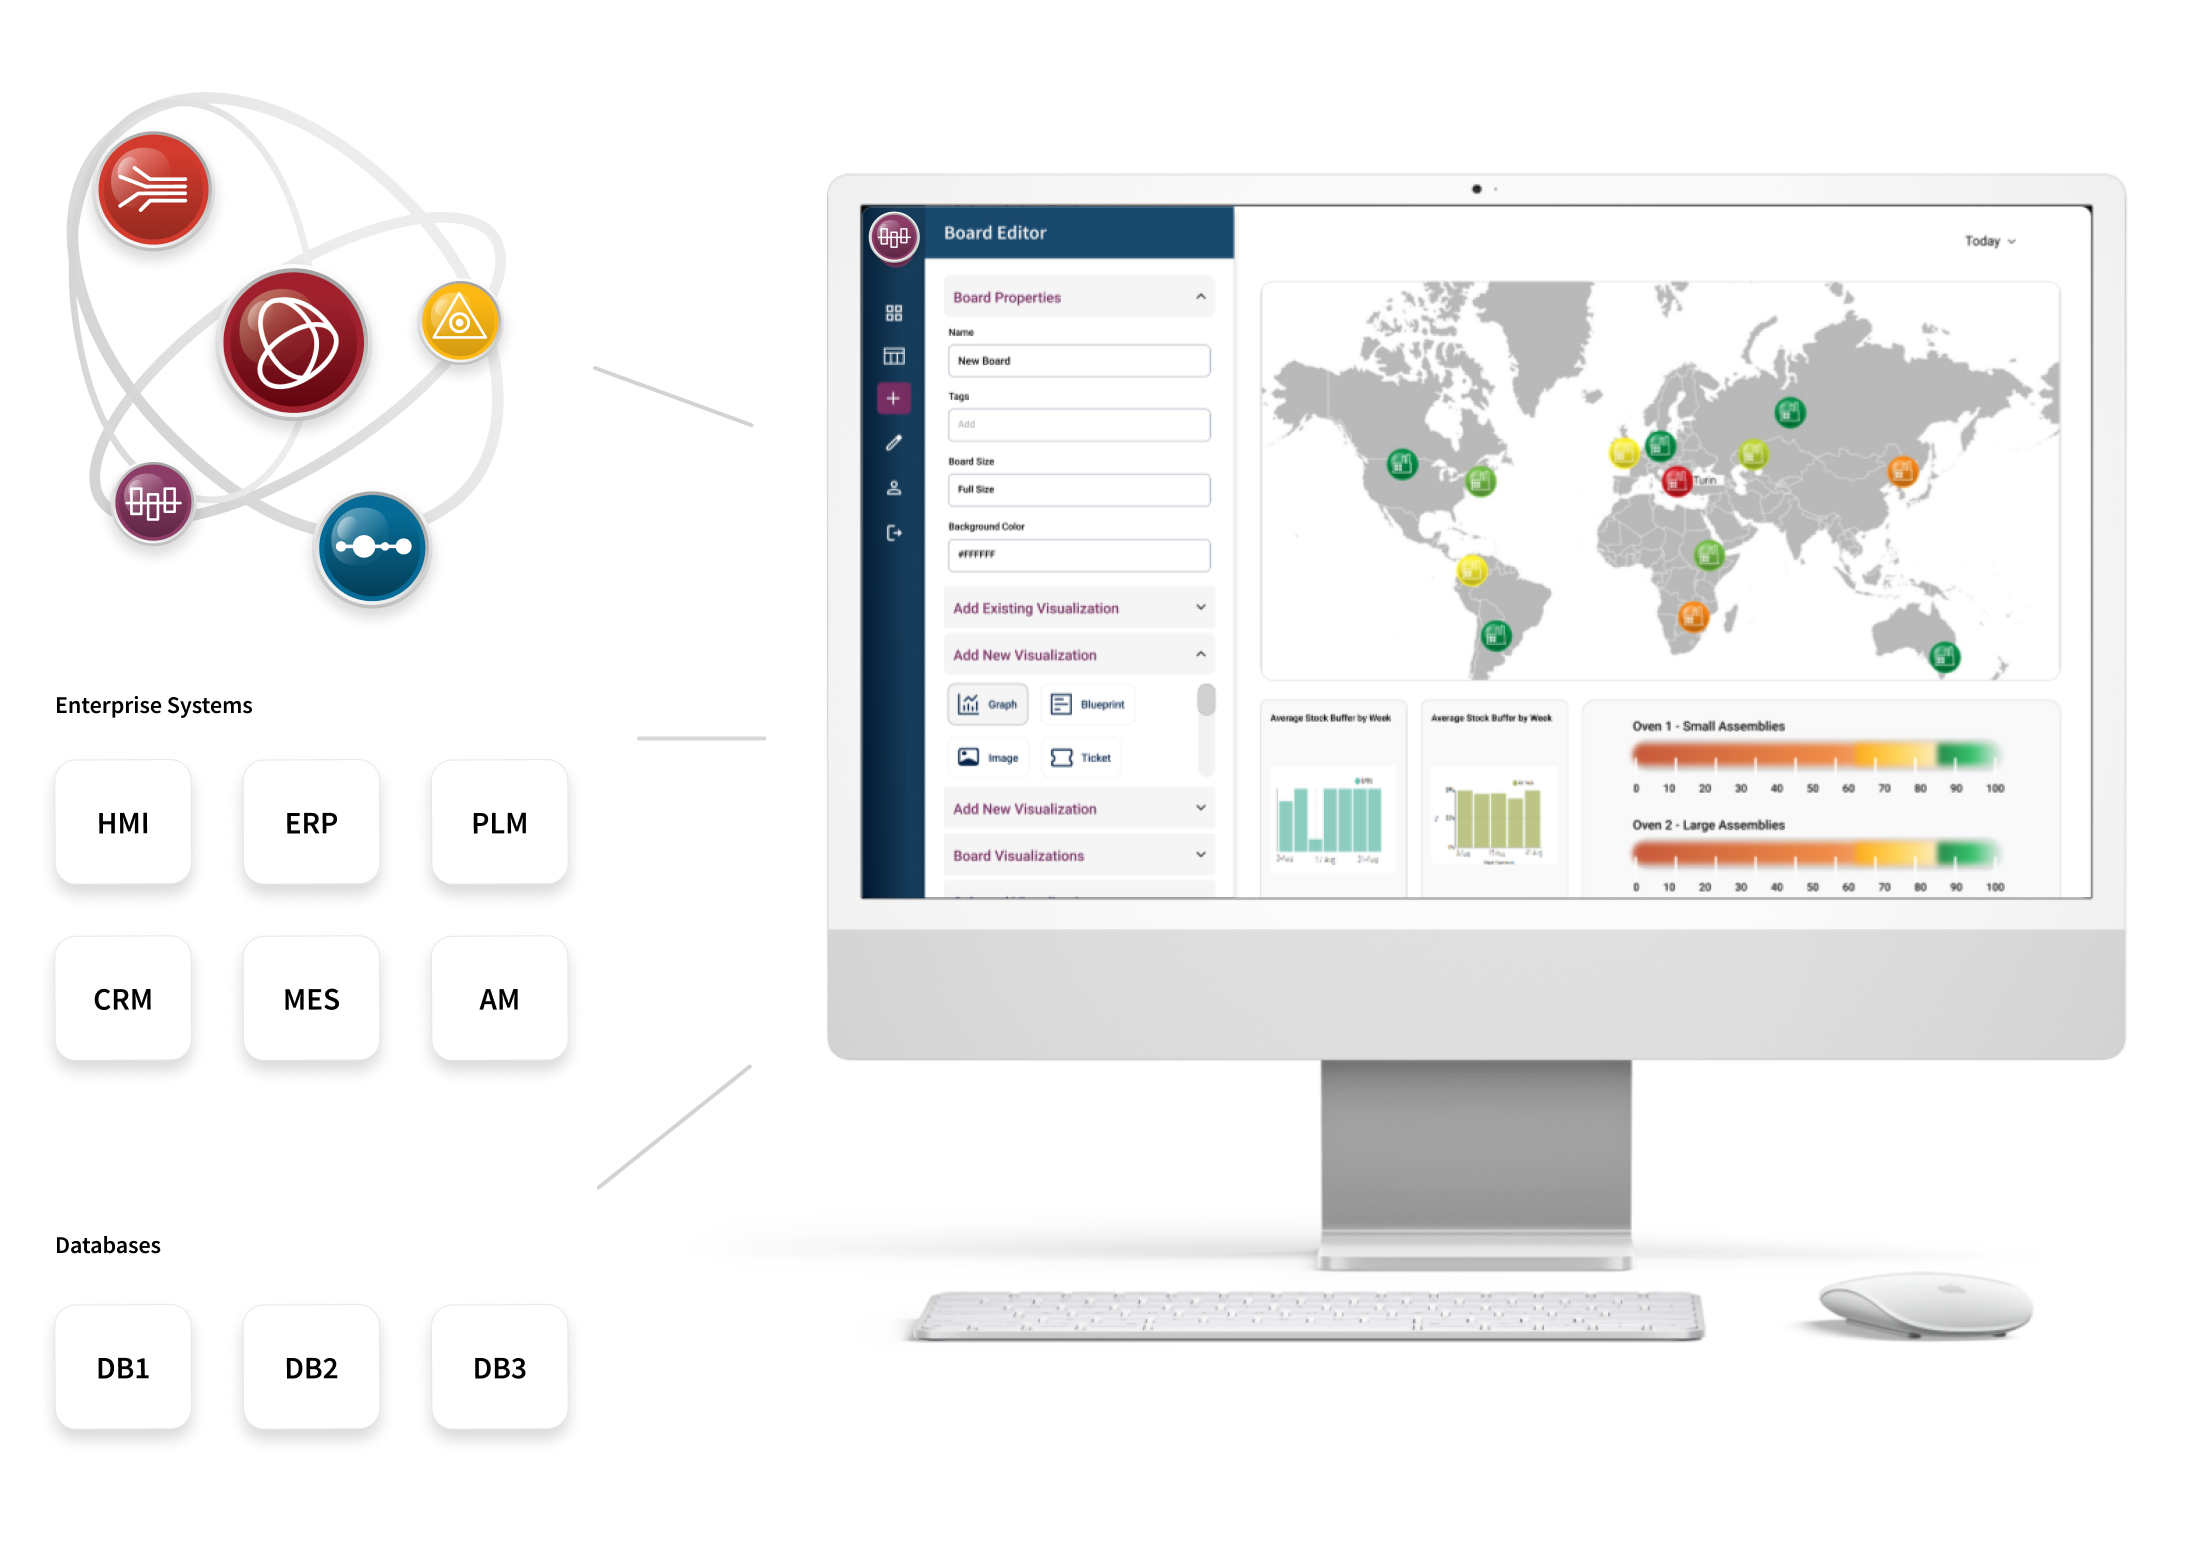
SyncView integrates effortlessly with your existing systems, evolving alongside your data and organization as it grows. This powerful software offers a unified view of your digital ecosystem, pulling real-time data from machines, tools, sensors, enterprise systems, applications, and Synchrono® software. With unlimited display and data configuration options, SyncView provides a flexible and comprehensive way to visualize information from any available source.
Synchronize Systems and Databases
SyncView software can display information from other systems and databases, including the Synchrono Demand-Driven Manufacturing Platform. Some of these systems include:
Customizable Templates
Kickstart dashboard creation with customizable templates – covering everything from pie charts, Gantt charts, tables, and more. Easily add, edit, and arrange visual elements.
Continuous Dashboard Slideshows
Share your work and get input on the spot by pulling interactive dashboard screens that are important to your team.
Responsive Interfaces
Seamlessly monitor performance and access dashboards on any device—tablet, phone, or desktop—anytime, anywhere.
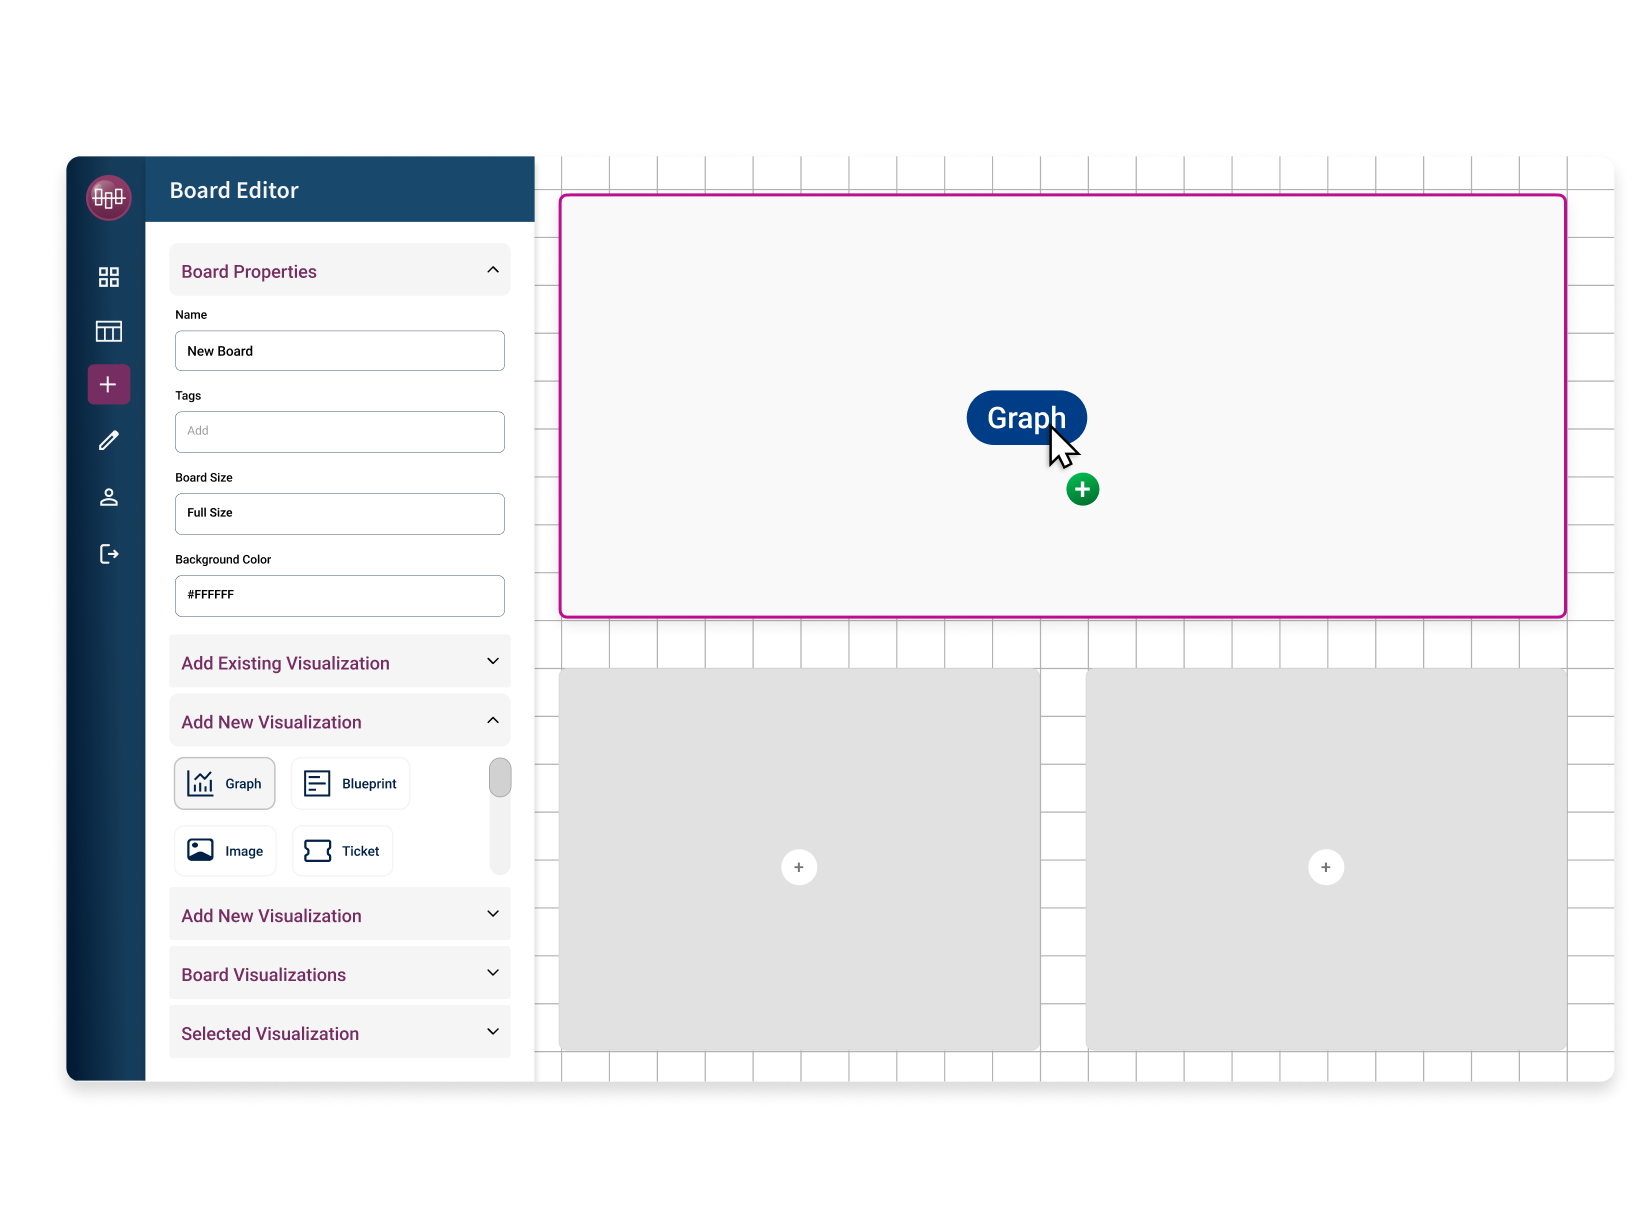
No-Code Visualization Dashboards
Say goodbye to relying on IT or complex coding. The SyncView no-code visualization creates and monitors performance metrics effortlessly. Using drag-and-drop interface and pre-built components, you can create functional dashboards in minutes.
Automated Workflows and Alerts
Proactively maintain performance with workflows and automated alerts whenever progress deviates from projections, so issues are quickly identified and resolved.
Report Management and Control
Manage reports and interactive dashboards in one centralized location to help ensure governance and control. Create static reports or fully interactive dashboards with functions such as drill down and filtering.
Unlimited Visibility. Tailored for Your Business.
SyncView supports an extensive range of operational, planning, and execution metrics, because your dashboards shouldn’t be limited by software. Boards are fully customizable, allowing teams to display the exact metrics they need, whether they’re widely adopted KPIs or highly specialized indicators unique to your environment. If your team can define it, SyncView can visualize it.
- Enterprise metrics
- Facility metrics
- Work cell metrics & status
- 5S reporting
- Quality metrics
- Product line metrics
- Customer service metrics
- Workstation metrics
- Supply Chain metrics
- Capacity analysis
- Inventory vs. Forecast
- Item demand
- Replenishment performance
- Order performance
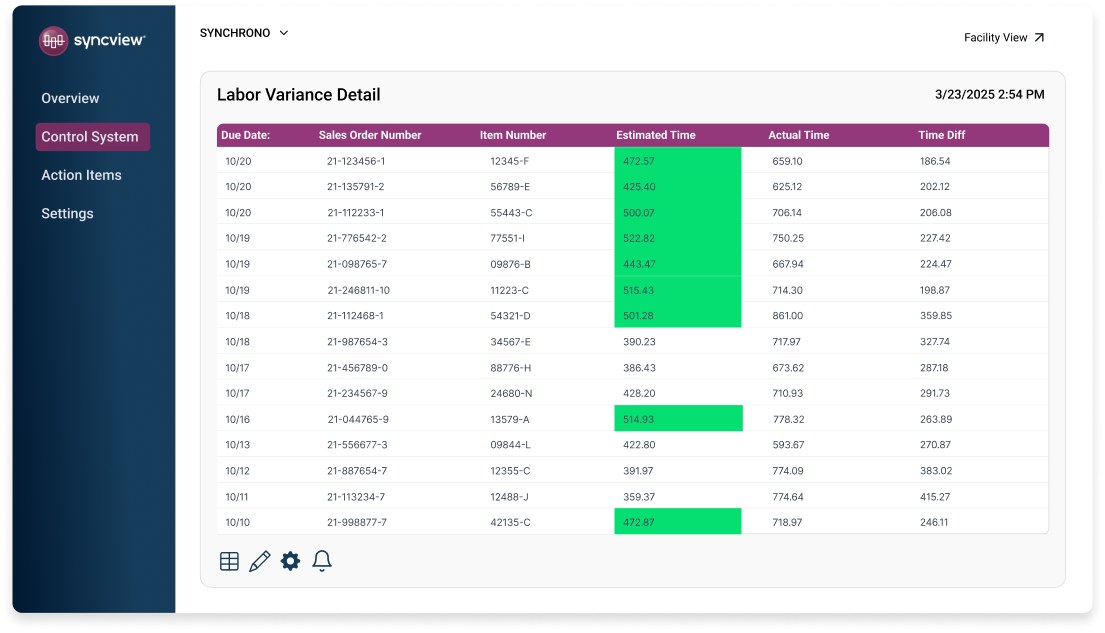
- Labor metrics
- Work cell assessments
- Operations metrics
Enable Continuous Improvement with Manufacturing Analytics
Start tracking manufacturing metrics with SyncView and improve your manufacturing operations today.
How can SyncView® help us implement sustainable performance improvements?
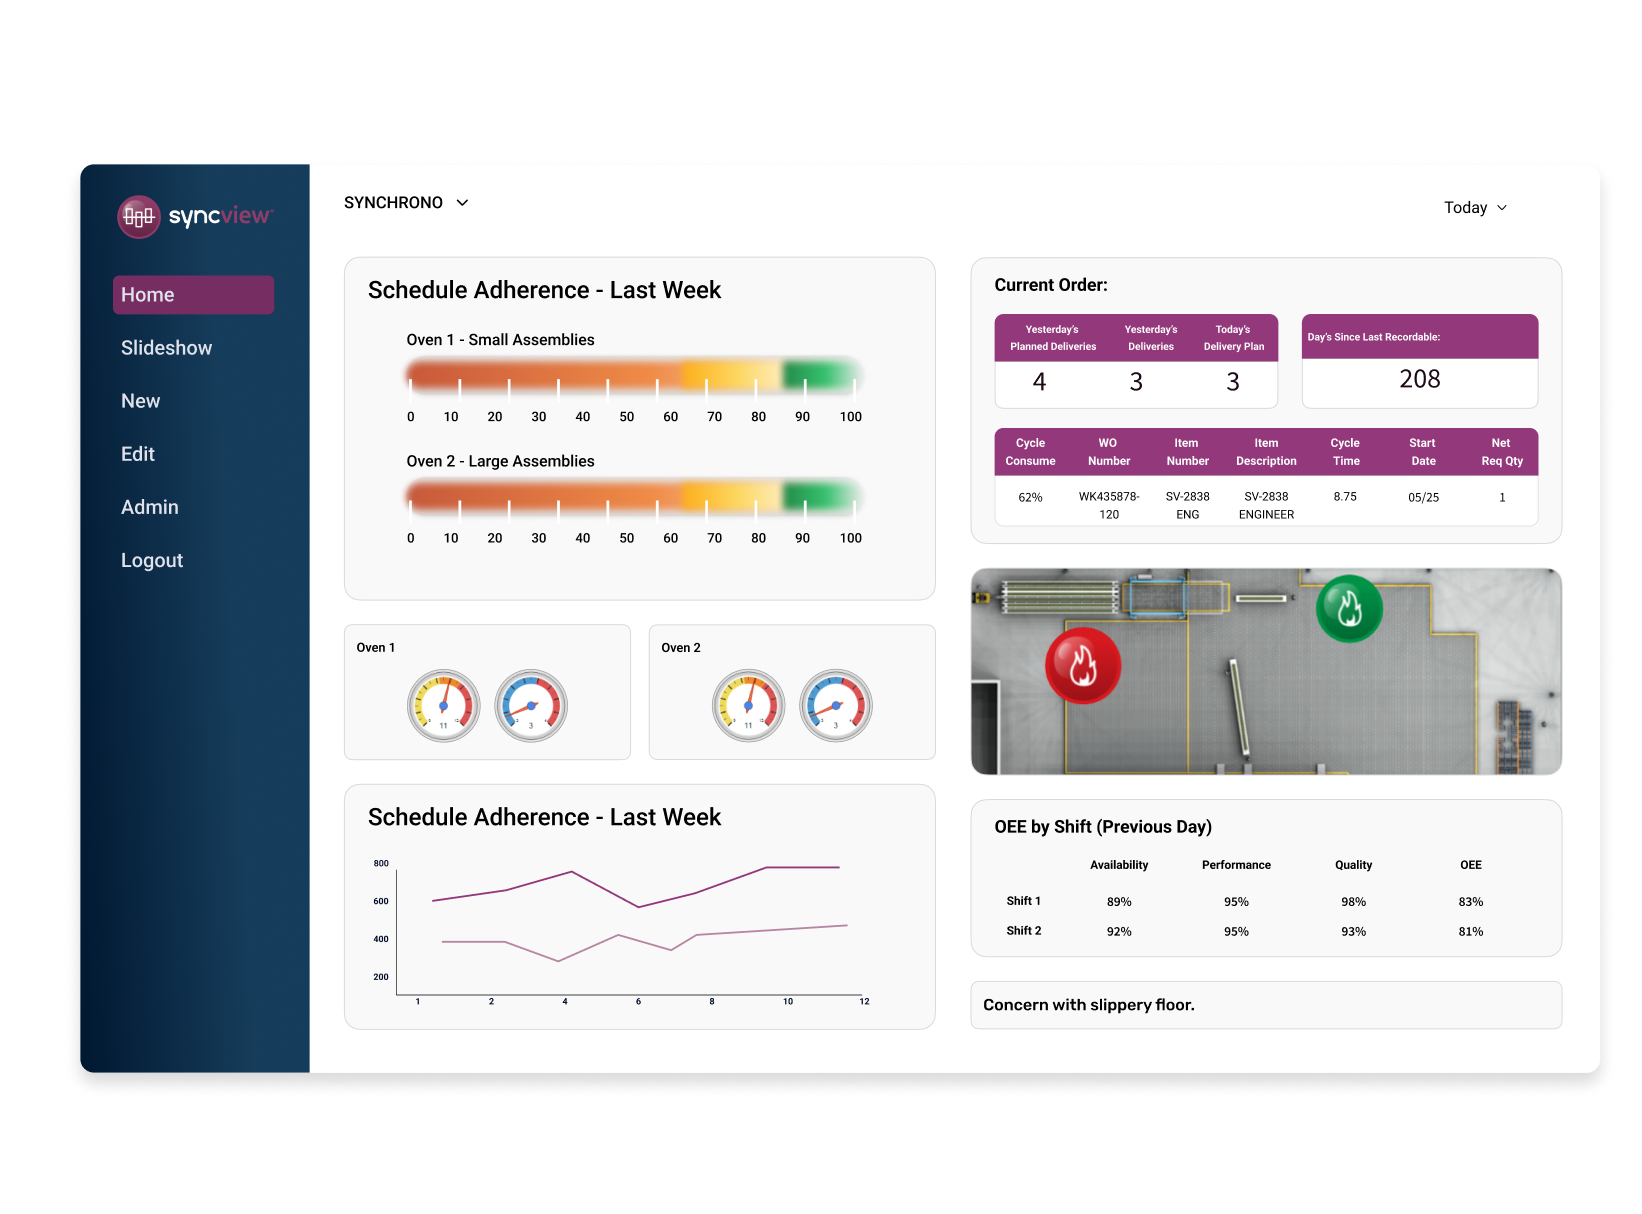
Monitoring relevant, live data enables better decision-making and focuses the entire enterprise on meeting and exceeding key performance metrics. Using SyncView, operations managers and production teams can see real-time performance against critical KPIs such as on-time deliveries, Overall Equipment Effectiveness, downtime, machine health, defect/rework rates, cycle times, throughput, and more.
Learn how Orbital ATK’s Aerospace Structures Division uses SyncView to power a real-time visual factory, giving leaders and operators shared KPI dashboards that help improve flow, increase capacity, and prevent issues before they impact safety, quality, delivery, employees, or cost. Read the case study.
Can anyone create a Dashboard in SyncView?®
SyncView software was designed to give everyone within the organization the power to create Dashboards; programming or coding experience is NOT required. The software’s interface and menu structure are highly intuitive. To build a Dashboard, users simply drag and drop existing visual elements onto a Board canvas or create their own content by connecting to available data sources.
Boards can reflect high-level enterprise status or information specific to a work cell or machine. They may be easily shared with others and/or reconfigured as needs change. Users can quickly drill into detailed information to drive decisions and more focused actions.
If I want to monitor an external source, such as a machine, using SyncView®, what format does the data need to be in?
SyncView can connect to relational databases, such as SQL Server, Oracle, and Microsoft Access, and to file-based sources like XML and Excel. If your data is logged or mapped into one of these supported sources, SyncView can read the fields you select and visualize them as KPIs on its dashboards.
Can SyncView® help us manage escalations, or do I need SyncAlert® for that?
SyncView can handle basic alerts and simple escalation-like notifications, but it is primarily a real-time visualization and analytics tool. It’s best for making issues visible on dashboards, surfacing exceptions, and notifying teams when KPIs or machine conditions cross defined thresholds.
SyncAlert is designed specifically for structured escalation management. It supports multi-level escalation paths, role-based notifications via email or text, time-based escalation rules when issues are not resolved, and tracking of response and resolution times. In practice, you can rely on SyncView alone for visual alerts and simple notifications, but SyncAlert adds more formal, auditable escalation workflows and accountability.
Can SyncView® production dashboards be defined by user, area, or team?
Yes. SyncView production dashboards can be configured for individual users, particular work centers or areas, and defined groups or teams. Dashboards are built from customizable templates and nocode components, which can then be tailored to show only the metrics and data streams that matter to a given role or production area.
Dashboards can also be shared or displayed at different organizational levels, from a single operator’s station to plantwide or multiplant enterprise views, ensuring each team sees performance for its own lines, cells, or value streams while leadership sees rolledup views across areas and facilities. This flexibility makes it straightforward to align dashboard definitions with assigned responsibilities.
How does adding SyncView to SyncManufacturing® increase shop floor visibility?
SyncManufacturing® provides real-time visibility into orders, schedules, constraints, and material status, but that visibility is primarily structured around jobs and flow through the production system. It is excellent for understanding priorities, bottlenecks, and promise dates at the planning and scheduling level, with views oriented around orders, resources, and constraints rather than a live visual map of the floor.
SyncView adds a dedicated visual factory layer on top of that transactional view, turning machine, sensor, and system data into live, role-based dashboards and shop-floor layouts. It provides ataglance status by machine or cell, color-coded icons, drilldowns, and KPI boards that can run on any device, giving operators, supervisors, and leadership a synchronized view of what is happening on the factory floor in real time.
Can I track KPIs in SyncView® using data from external applications like ERP, MES, PLM, or asset management?
Yes. SyncView is designed to pull and visualize data from a wide range of external systems—including ERP, MES, PLM, CMMS/asset management, and other production or business applications—so those data streams can be incorporated easily into SyncView Dashboards. Through standard interfaces and integration services in the Synchrono platform, transaction, status, and event data from these systems can be normalized and combined with machine and IoT data, then displayed as real-time metrics such as OEE, schedule adherence, inventory, quality, and maintenance performance.
This means KPIs in SyncView can reflect end-to-end performance, for example linking ERP order and inventory data with MES execution data, giving users a single, synchronized view of operations instead of separate reports from each system. As integrations evolve, additional external sources can be added without changing how users interact with the dashboards.
Do I need to have SyncManufacturing® implemented to use SyncView®?
SyncManufacturing is not required to start using SyncView. SyncView is sold and implemented as its own product and can connect directly to data in your existing databases and enterprise systems, including ERP, MES, or other applications, through standard or custom plugins. This allows organizations to adopt SyncView as an initial step toward greater visibility, then expand into full demand-driven planning and scheduling when ready.
Are SyncView® Dashboards available from a mobile device?
Yes. SyncView Dashboards are available on mobile devices through responsive web interfaces that automatically adapt layouts for phones, tablets, and desktops. Users can access the same boards they see on large displays or PCs from their mobile browser, allowing supervisors and managers to monitor production status, alerts, and KPIs while away from the control room or shop floor.
Does implementing or using SyncView® require any special technical expertise?
Connecting SyncView to databases or enterprise systems (SQL Server, Oracle, ERP, MES, etc.) is typically handled by IT or a technically skilled admin who can configure plugins, credentials, and any custom queries or views. Once those connections are in place, business users can build and modify their own boards and KPIs with little to no IT involvement. Most of the skill needed is understanding which metrics matter for the role, process, or team.
How can SyncView® help us better manage vendor performance and our extended supply chain?
SyncView can act as a real-time visibility layer across your endtoend supply chain by aggregating data from ERP, inventory systems, eKanban, planning and scheduling, and logistics tools into a single view. This lets you see current order status, replenishment signals, inventory positions, and key logistics events in one place, instead of hunting through multiple systems.
Supply chain teams can use high-level Communications Boards to quickly identify global issues, like shortages, late or at-risk orders, and capacity imbalances, then drill down to specific plants, suppliers, warehouses, or orders to identify the root causes and take action. Different role-based views can be configured for executives, plant managers, planners, suppliers, and even customers, helping level load across sites, right size inventory, and monitor supplier performance against service levels.