- The Benefits of BI in Production
- Cycle Time Variance
- Order Release Adherence
- CONLOAD™ Adherence
- On Time to Due Date
- Schedule Adherence
BI Dashboards in SyncManufacturing® Version 8 deliver real-time visibility into production performance, model accuracy, and schedule adherence for discrete, complex manufacturers. Designed for operations leaders, plant managers, industrial engineers, planners, and schedulers, these dashboards transform live manufacturing data into actionable insights that support continuous improvement, better on-time delivery, and more efficient use of constrained resources.
The Benefits of BI in Production
Manufacturers universally recognize the need for clear, objective metrics, but without real-time visibility they are effectively flying blind. In the absence of timely data, leaders default to decisions driven by bias—recency, the squeaky wheel, or gut feel—rather than by facts. Limited resources then get pulled toward the loudest problems instead of the most value-added opportunities.
Real-time Business Intelligence (BI) changes that paradigm by transforming raw operational data into actionable insights. With SyncManufacturing BI Dashboards, managers can immediately see where performance is slipping before the problem impacts customers. Because the dashboards are directly connected to the live production environment, they also help managers align shop-floor execution with strategic objectives and give manufacturers the data-driven confidence to optimize scheduling, improve resource allocation, and drive continuous improvement.
Of course, every manufacturing enterprise will have its own definition of success, but goals like on-time delivery and effective resource utilization are nearly universal. In addition, many of the organizations we work with have ongoing continuous improvement initiatives that rely on performance monitoring. SyncManufacturing Version 8 includes five built-in BI dashboards to help manufacturers zero in on the metrics that matter most.
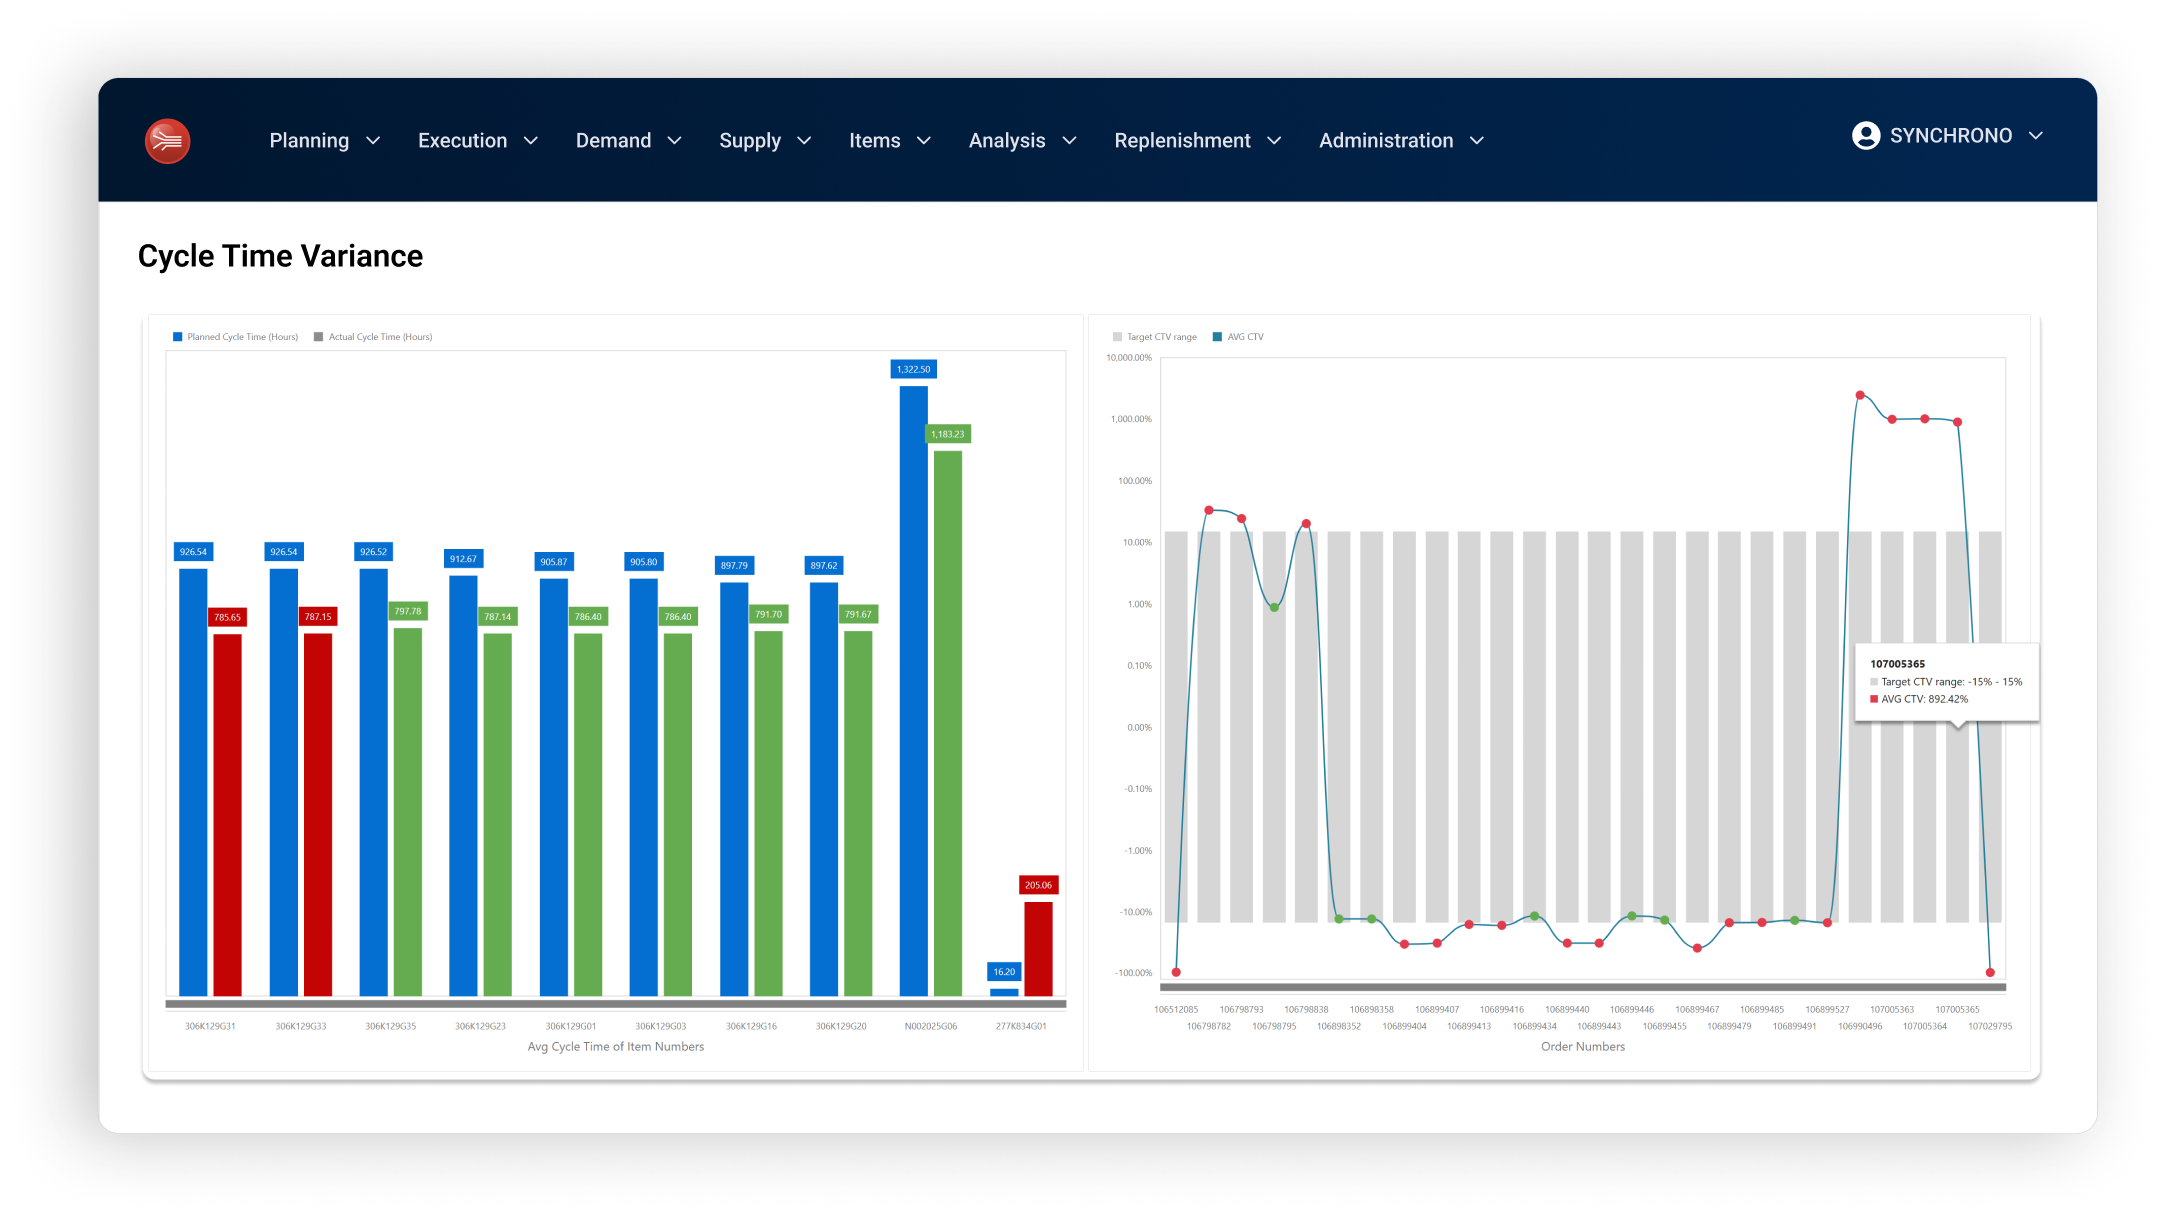
Cycle Time Variance (CTV)
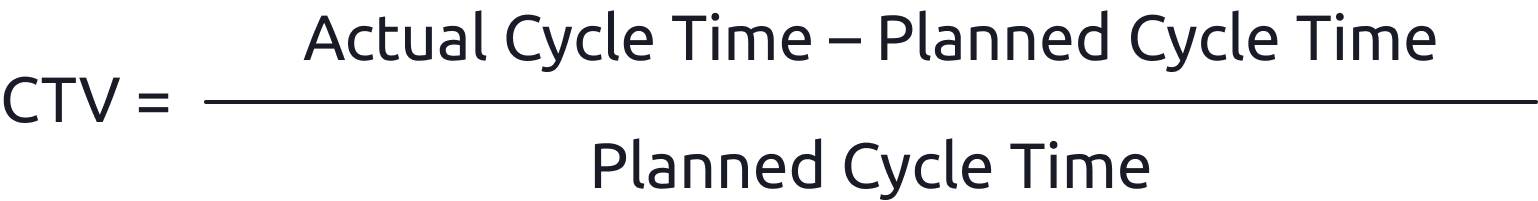
CTV measures how closely actual cycle times align with planned cycle times, revealing where routings and cycle-time parameters may be inaccurate. CTV is calculated as the difference between actual and planned cycle time, divided by planned cycle time, allowing users to see whether orders are typically running faster or slower than expected.
The dashboard highlights items with the largest positive or negative CTV, while a configurable “Target CTV Range” sets the acceptable variance. Users can quickly see which products fall outside the range, making it easier to prioritize which routings and items to review.
Who uses CTV?
Cycle Time Variance can be valuable for roles focused on process accuracy, continuous improvement, and routing integrity. For example, Industrial Engineers and Process/Manufacturing Engineers, Project Managers, Operations Managers, and Plant Managers can use it to validate whether planned cycle times reflect reality and to understand the impact of routings on throughput and on-time delivery.
How does CTV support Six Sigma or Lean?
In Six Sigma and Lean, CTV can be used to evaluate how consistently a process performs and how reliably it meets customer demand. Teams track variation in cycle times across units or runs to see whether the process is stable and capable at the required speed. High cycle-time variance signals problems, (e.g., inconsistent methods, equipment issues, or unstable staffing), which drive late orders, excess WIP, and quality risk. Reducing that variance is a core goal of Lean/Six Sigma projects.
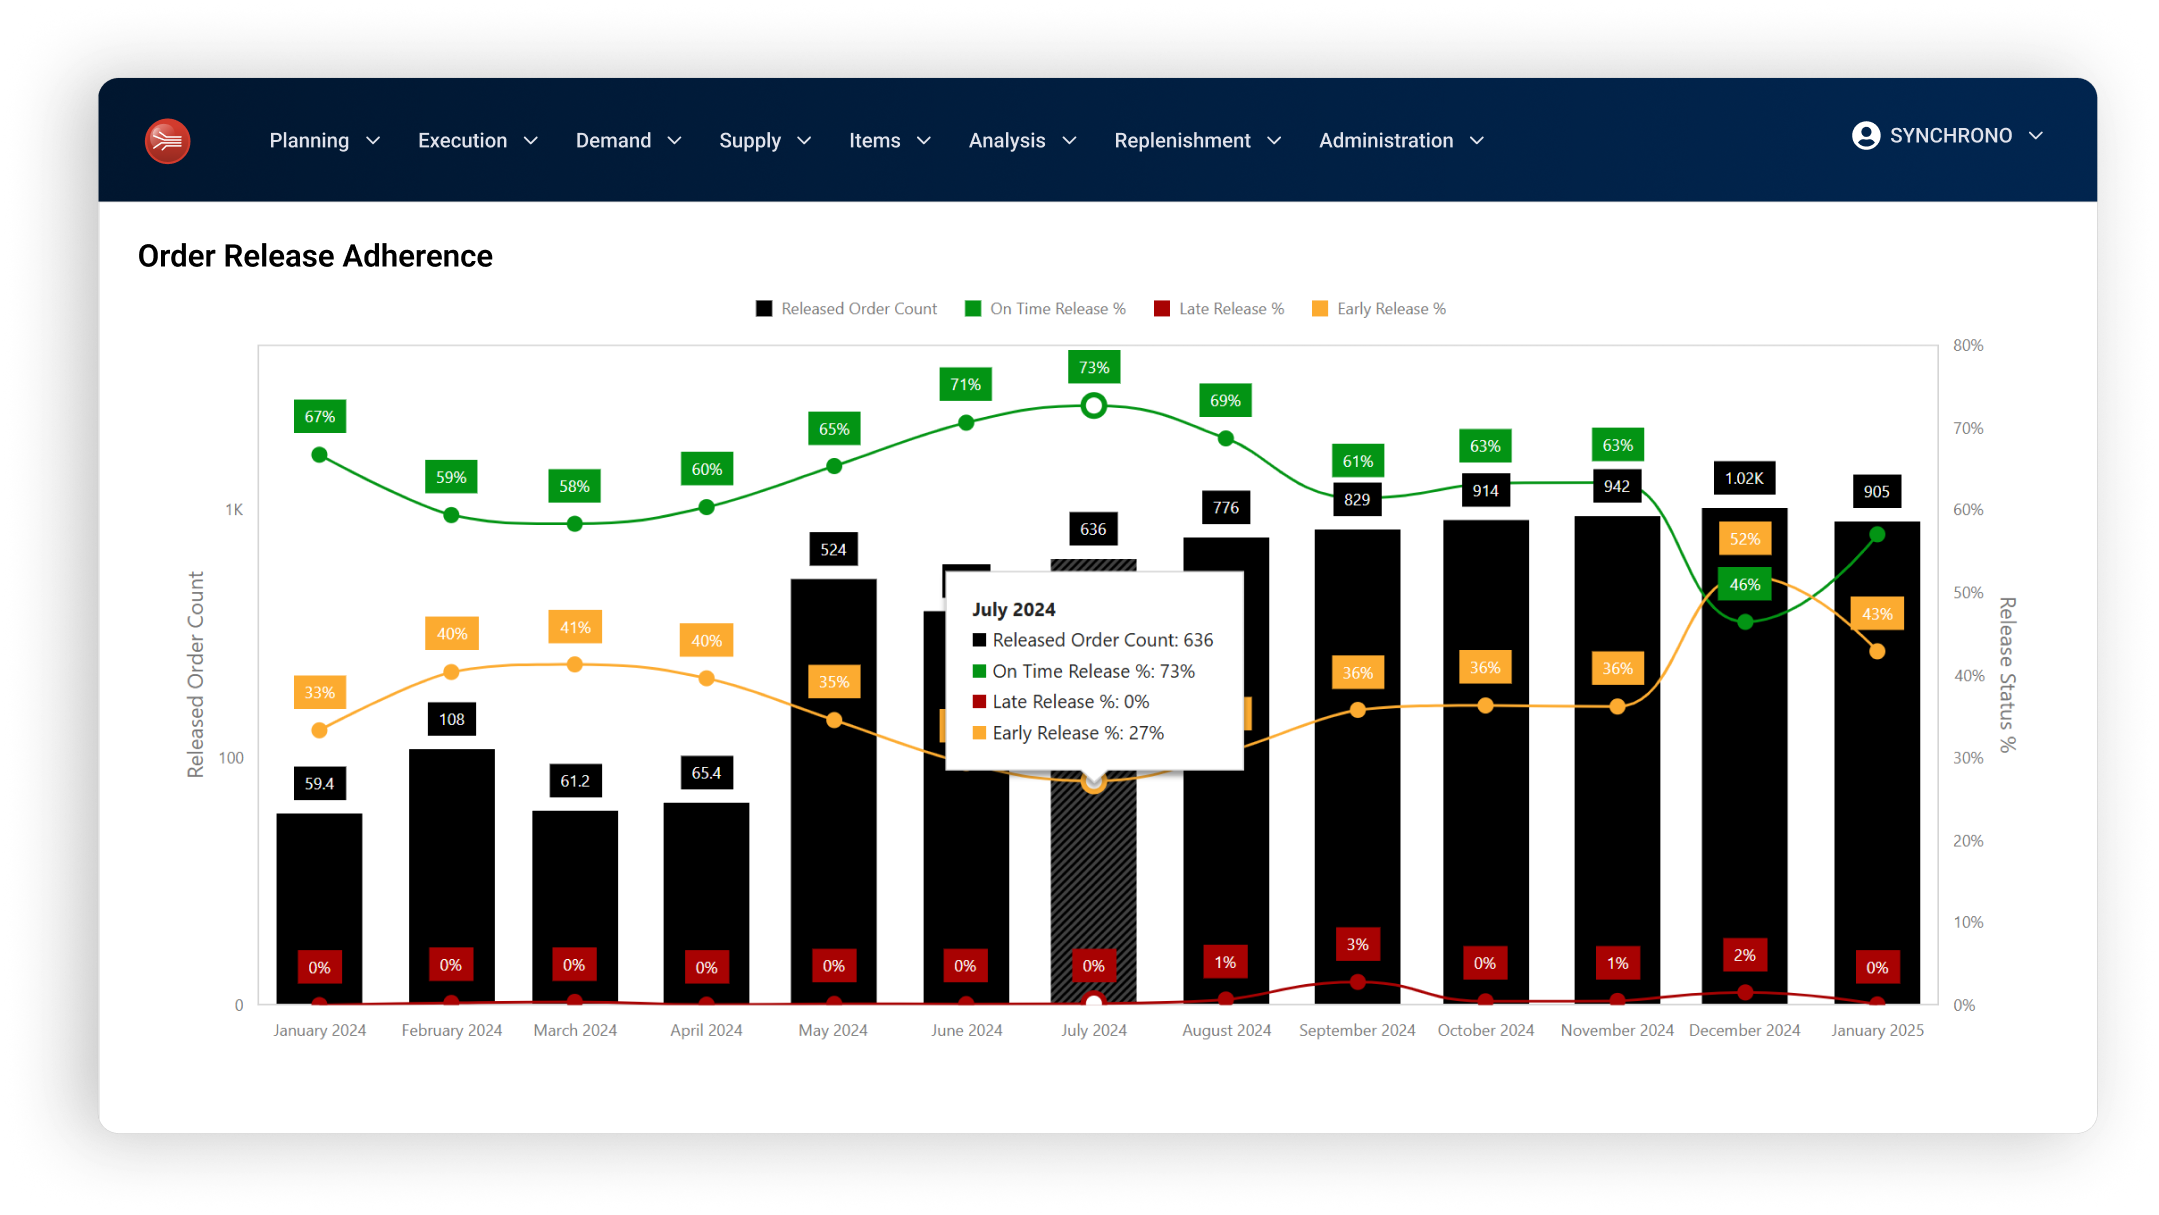
Order Release Adherence
Order Release Adherence analyzes how closely actual order releases follow scheduled order releases in SyncManufacturing. Users can define a custom time window (for example, a specific number of hours) that establishes what counts as on time, early, or late, and the dashboard automatically labels each release based on that rule.
A stacked bar visualization shows the distribution of on time, early, and late releases, while supporting grids provide counts and percentages by month to help planners and schedulers evaluate release discipline. Parameters allow users to adjust the starting release date and look-back window, ensuring the analysis aligns with current planning horizons.
Who uses Order Release Adherence?
The Order Release Adherence dashboard can be valuable to Planners, Master Schedulers, and Production Schedulers as they are responsible for the release schedule and need immediate feedback on how well execution matches the plan. Since adherence to release dates directly affects flow through production, optimization of constraint resources, schedule stability, on-time delivery, and plant throughput, Operations and Plant Managers rely on this dashboard to spot systemic issues in planning or floor discipline.
How does Order Release Adherence Support Six Sigma or Lean?
When releases follow the planned dates and quantities, WIP stays stable, queues are consistent, and issues impeding flow become visible instead of being masked by excess work—a core Lean objective. High adherence also improves schedule reliability and on-time delivery, which are critical customer-focused CTQs for many Six Sigma projects. When adherence drops, it points to specific root causes, such as unrealistic plans, unstable upstream processes, or capacity issues, that DMAIC or kaizen teams can analyze and correct, leading to more predictable lead times and higher throughput with less waste.
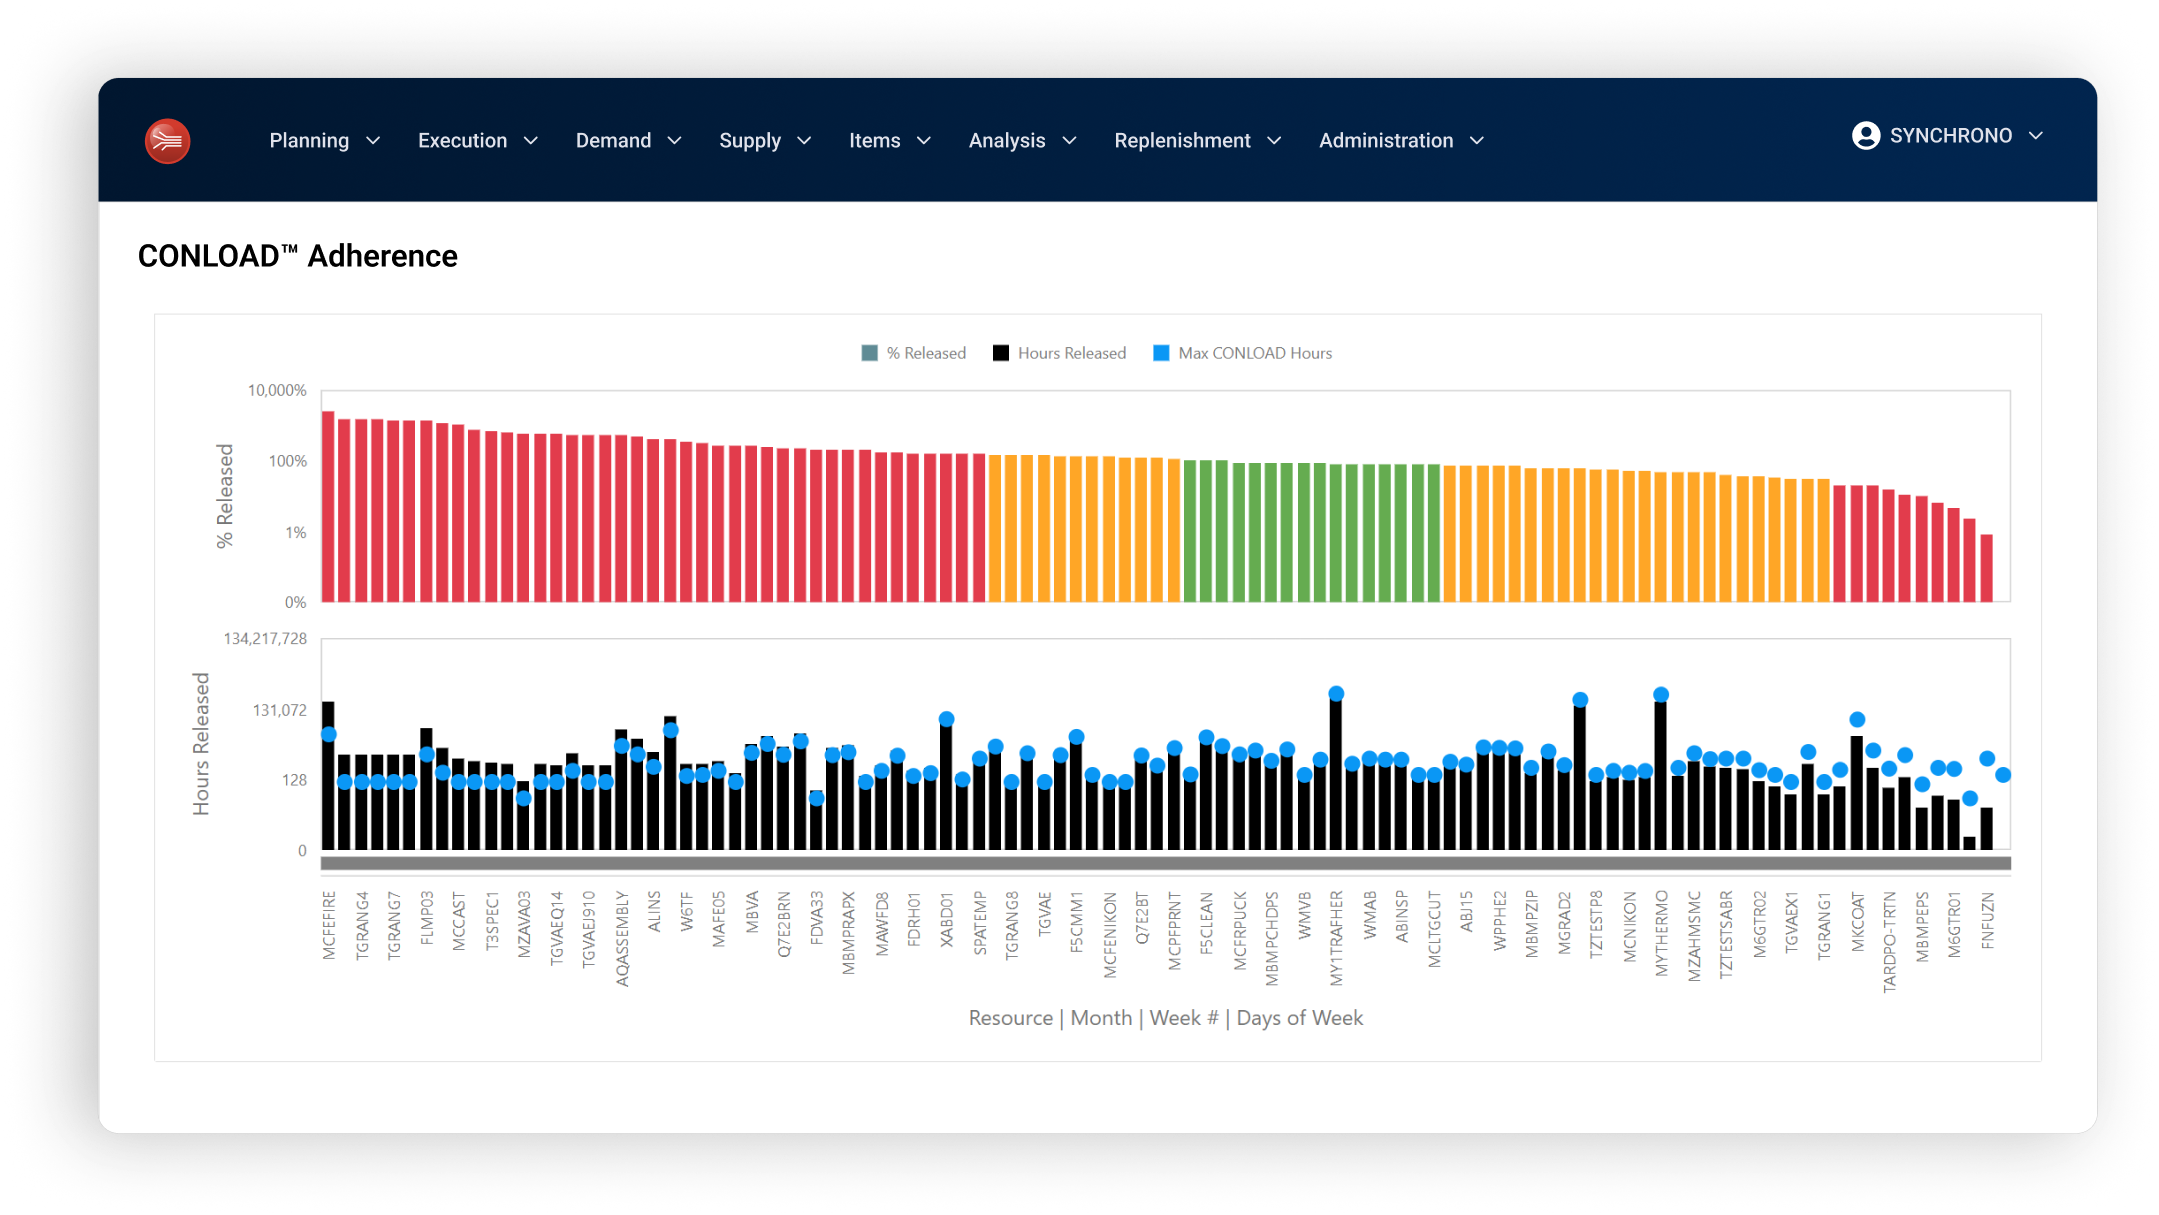
CONLOAD™ Adherence
The CONLOADTM Adherence dashboard focuses on constraint resource behavior and adherence to CONLOADTM parameters. This metric compares average released load hours to max load hours for constraint resources over a selected period, revealing whether a resource tends to be over-released, under-released, or in alignment with planned capacity.
When the average released load exceeds maximum load, work is essentially being released too soon, which increases WIP, lengthens lead times, and makes completion dates less predictable. By highlighting over-released resources, the dashboard helps teams determine whether execution is out of alignment with company strategy.
Who uses CONLOAD™ Adherence?
The CONLOADTM Adherence dashboard is important for roles responsible for managing constraint resources and overall flow: Operations Managers, Plant Managers, and Master Schedulers. They need to see whether highly loaded resources are being over‑released or under‑released relative to CONLOADTM parameters, because that directly affects synchronization, flow, throughput, and on‑time delivery.
Industrial Engineers and continuous improvement leaders are also likely users, since they focus on optimizing constraint utilization and validating whether the modeled CONLOAD™ settings are producing the desired behavior on the floor. By comparing average released load hours to the modeled maximum load hours, they can quickly identify where to adjust planning rules or execution discipline to improve throughput without overloading key resources.
How does CONLOAD™ Adherence support Six Sigma or Lean?
CONLOADTM Adherence supports Lean and Six Sigma by ensuring constraint resources are loaded in line with capacity assumptions to avoid overloading or starving constraint resources. By comparing released load hours to the modeled maximum load hours at each constraint, the metric reveals when constraint‑based rules are being violated and contributing to excess WIP, unstable queues, and longer, more variable lead times.
For Lean and Six Sigma teams, the CONLOAD™ Adherence dashboard provides a clear, quantitative way to monitor whether the company release strategy is being followed. When CONLOAD™ Adherence shows chronic over‑ or under‑release, teams can use DMAIC or kaizen to identify root causes, such as lack of training or policy conflicts.
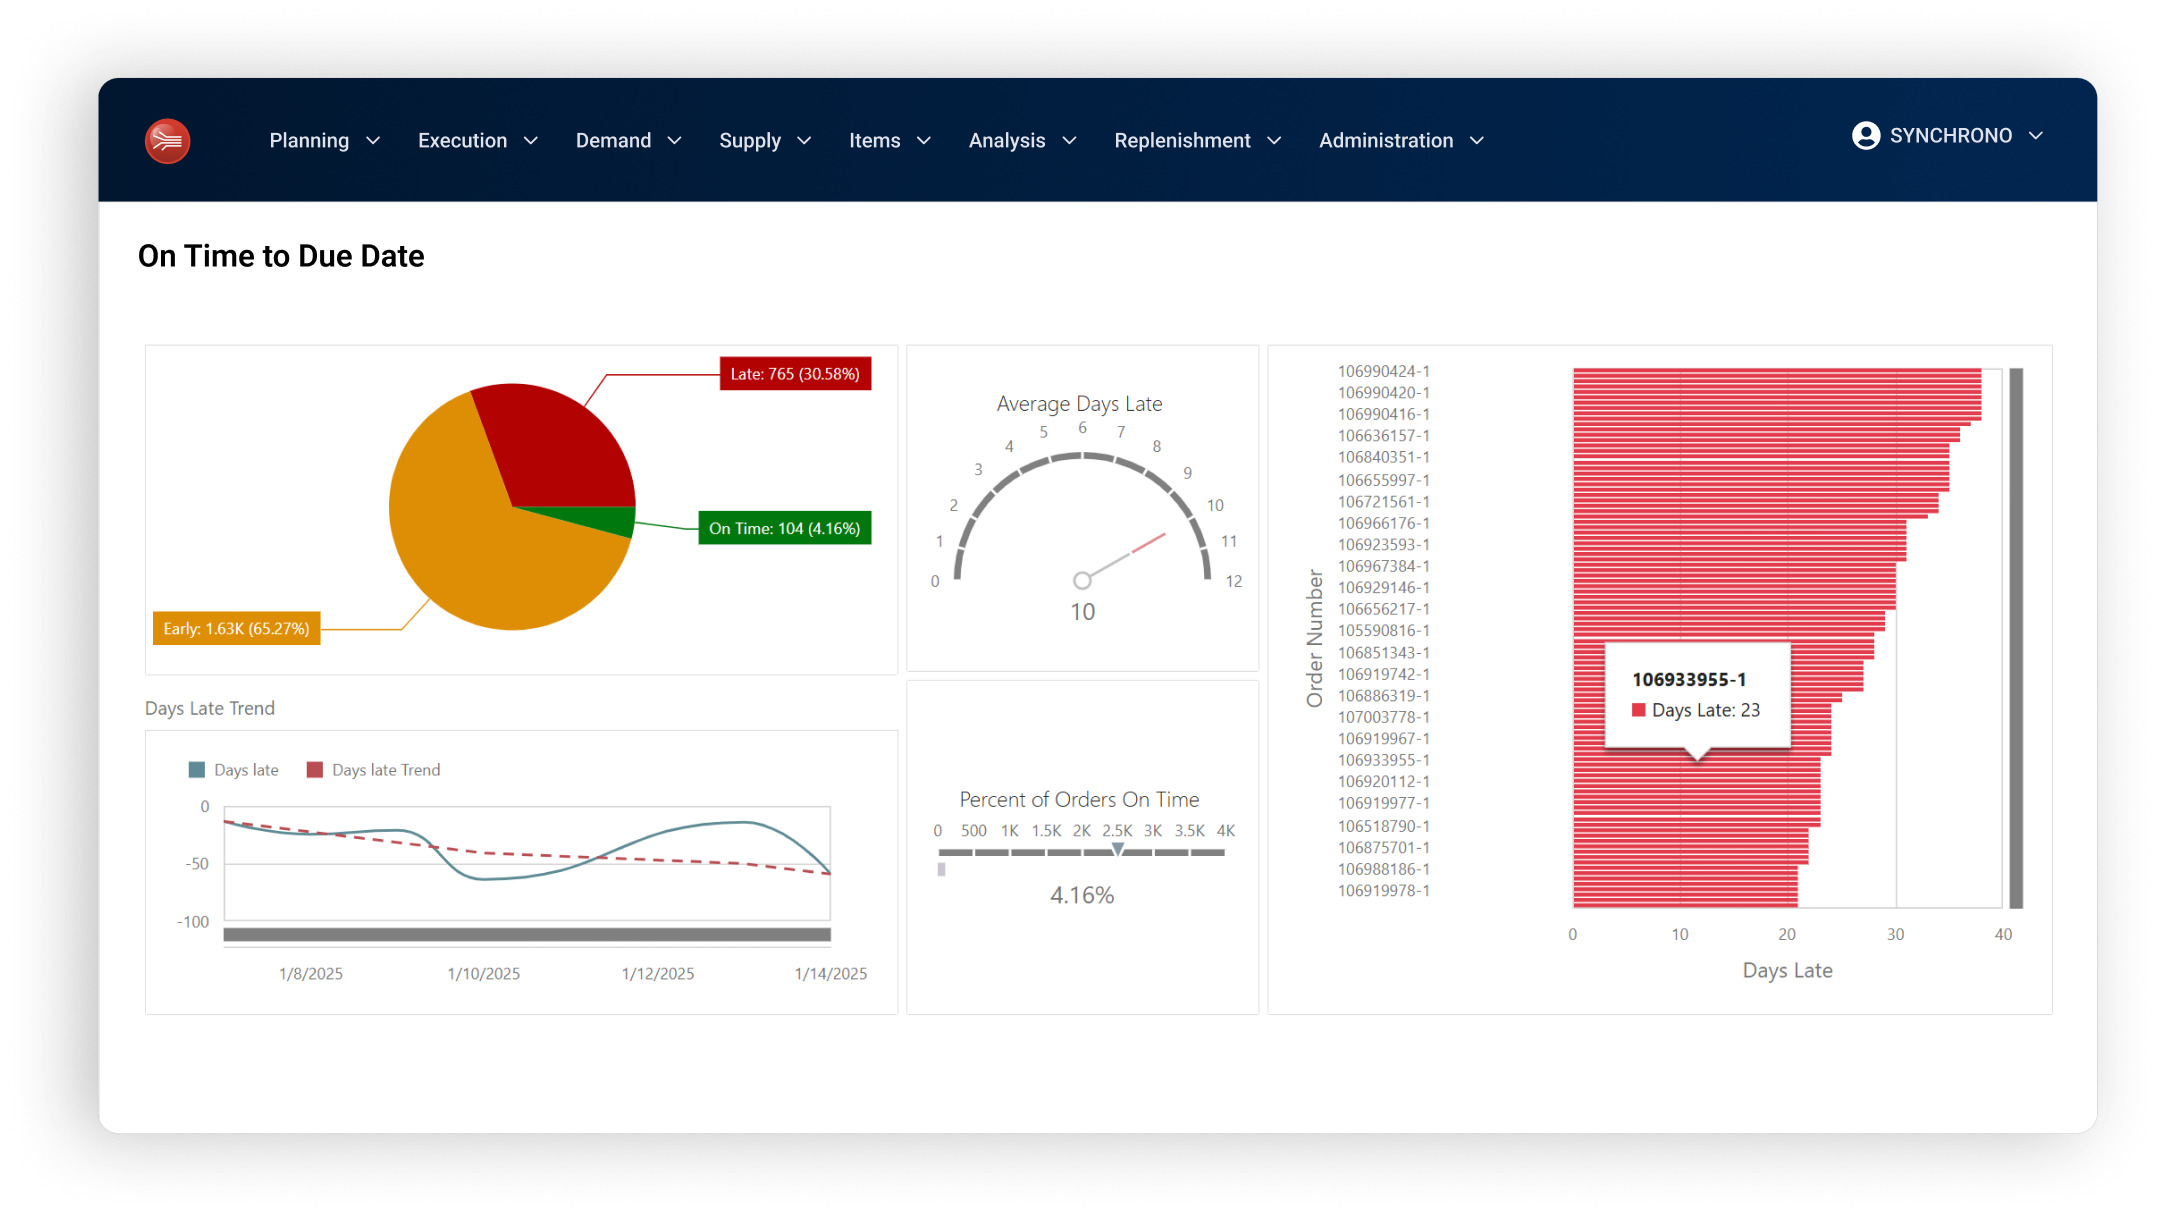
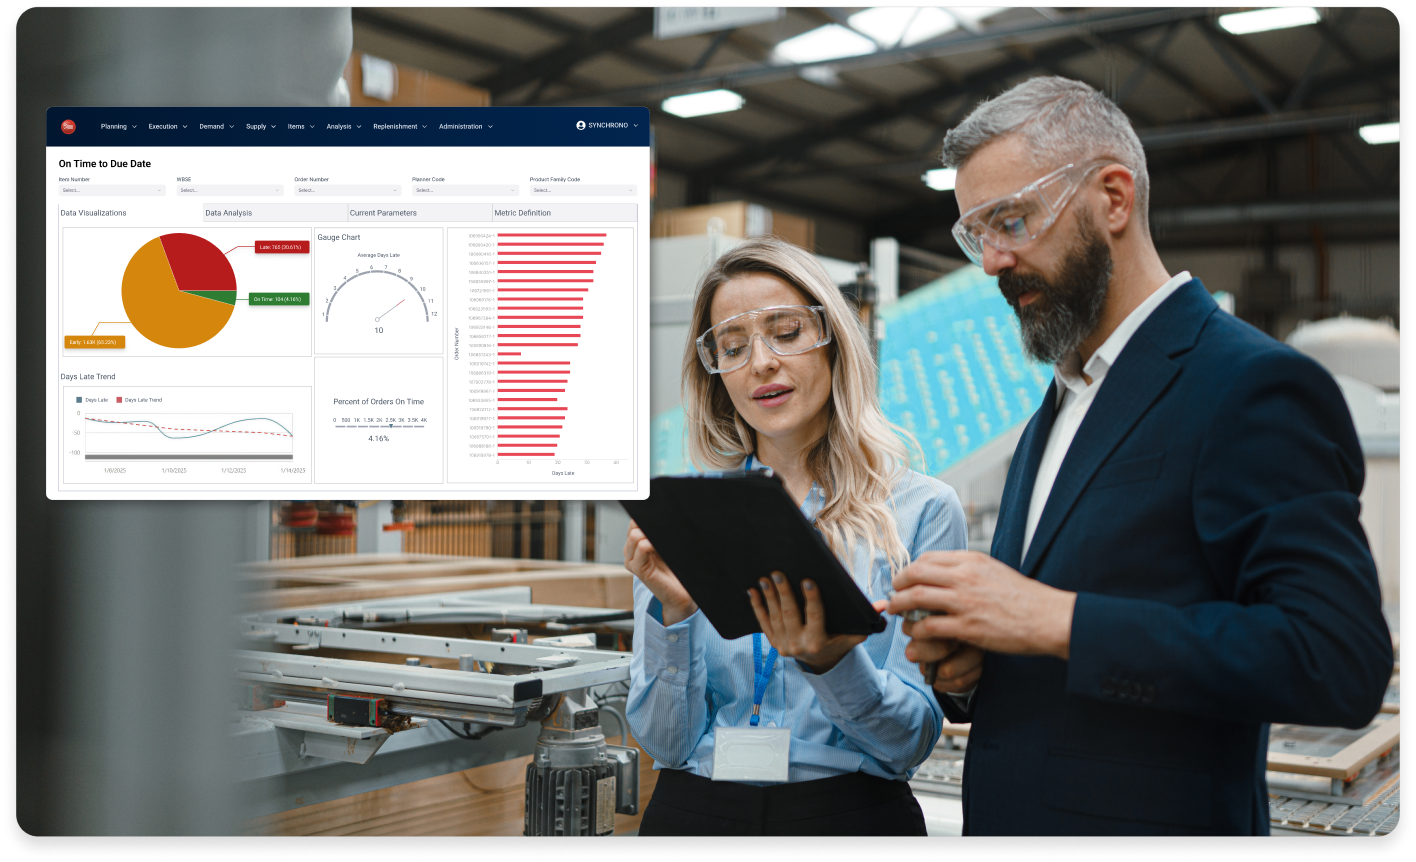
On Time to Due Date
The On Time to Due Date dashboard provides both projected and historical views of delivery performance, categorizing orders as early, on-time, or late based on a configurable lateness tolerance. The lateness tolerance parameter defines a window around the due date within which an order is considered on-time, allowing manufacturers to align the metric with customer expectations and service-level commitments.
Users can analyze open orders based on current projected completion dates and completed orders to assess on-time reliability. Parameters for due-date ranges and tolerance thresholds make it easy to evaluate multiple scenarios and sensitivity to different service-level assumptions.
Who uses On Time to Due Date?
On Time to Due Date is primarily used by Plant Managers, Operations Managers, and VP‑level decision makers who are accountable for on‑time delivery and overall customer service performance. Planners, Master Schedulers, and Customer Service teams also rely on it to monitor current risk to promised ship dates and to prioritize which orders need attention to protect customer commitments
How does On Time to Due Date support Six Sigma or Lean?
On Time to Due Date directly supports Six Sigma and Lean because it measures a core Critical-to-Quality requirement: delivering orders when customers expect them. By tracking the percentage of orders that are early, on-time, or late based on the defined tolerance, teams can quantify delivery reliability, a standard Lean/Six Sigma metric often expressed as on‑time delivery rate.
In improvement projects, this KPI becomes the primary outcome measure for efforts to reduce lead time, reduce variability, and eliminate waste, such as waiting, rework, and expediting. When On Time to Due Date slips, Lean or DMAIC teams can drill into upstream causes, such as schedule adherence, capacity constraints, or transport delays, and verify that their changes are working as on‑time performance moves toward the target sigma level.
Schedule Adherence
The Schedule Adherence dashboard shows how reliably the shop floor is sticking to the priority generated in SyncManufacturing. This dashboard compares the order in which the work is executed as compared with the priority laid out by the schedule. Advanced Planning and Scheduling (APS) solutions are focused on global optimization of operations. Often times resources on the shop floor prioritize local optimization because there is not a clear picture of how their actions impact the flow of the organization. Schedule Adherence measures how well all resources in the operation are supporting global flow and synchronization. It points out where there are conflicts, where additional training is needed, and areas where the organization can improve.
Who uses Schedule Adherence?
Planners, master schedulers, and operations leaders can use this dashboard to monitor day-to-day discipline in following the schedule and to validate whether their release strategies, scheduling methodologies, and overall processes are optimal. With real-time and historical views in a single, visual interface, they can quickly analyze trends to see if there is improvement or decline and the current state to see if there are emerging issues. Improving schedule adherence improves stability, synchronization, and flow, supporting higher throughput and better on-time performance.
How does Schedule Adherence support Six Sigma or Lean?
Schedule Adherence supports Six Sigma and Lean by measuring how reliably the plant executes to the production schedule —a core indicator of process stability. High schedule adherence means work priority is followed, which reduces variability and excessive WIP, protects on‑time delivery, and removes a large, controllable source of noise so Lean or DMAIC teams can clearly see where to focus continuous improvement.
Understanding Business Health: The Foundation of Continuous Improvement
Successful, sustainable performance improvement starts with seeing the truth about how your plant is performing—not just at month‑end, but right now—so you can keep your efforts focused on the areas that matter most. With SyncManufacturing V8 BI Dashboards, you gain real-time insight into current performance and trends, making it easier to make sustainable performance gains and quickly course‑correct when conditions change.
Contact us for more information or schedule a demo to see how SyncManufacturing BI Dashboards can turn your production data into a practical roadmap for a healthier, more resilient manufacturing business.