Author: David Dehne

  • Thought Leadership: Three Key Strategies of Modern Demand-Driven Manufacturing

    Thought Leadership: Three Key Strategies of Modern Demand-Driven Manufacturing

    Today’s manufacturers are meeting complex market demands while maintaining desired levels of customer satisfaction, supplier performance and production throughput by applying Modern Demand-Driven Manufacturing strategies that enable a more connected environment and serve as the catalyst for progressive concepts, including:

    • The Industrial Internet of Things
    • Smart Manufacturing
    • Synchronized Planning, Scheduling and Execution
    • End-to-end Supply Chain Visibility

    Download this paper for an overview of the three key strategies of Modern Demand-Driven Manufacturing

  • Guest Blog Part 2: Start Your eKanban Implementation with Value-stream Mapping and Engaging Your Suppliers

    Guest Blog Part 2: Start Your eKanban Implementation with Value-stream Mapping and Engaging Your Suppliers

    by Jim Shore

    Through this guest blog series, my intent is to share some of my experiences implementing supplier quality and Lean manufacturing initiatives by focusing on eKanban systems. My first post offered advice for planning an eKanban rollout (advice that could be applied across any Lean manufacturing project). In this installment, I’d like to talk about strategies for rolling out an eKanban project that have proven successful for me.


    Whether you use Google maps, Apple, MapQuest or some other breed of navigation, you know you must enter both a starting location (or allow the system to “know” your current location) – and a desired destination. Too often, I see manufacturers get excited about the destination of best-practice process improvement without carefully considering the starting point.


    Value-Stream

    The Value in Value-Stream Mapping

    In my view, the process starts by gaining a clear understanding of the current, “as is” state, because you can’t make process improvements unless you can explain the problem you are working to resolve. With eKanban implementations, this can be any number of problems including excess materials on hand, slow inventory turns, too much scrap and more.

    So, once you have universal buy-in on the project (see Guest Blog1: Real-world Advice for Getting Started on eKanban), the first step toward execution is to develop a good process, or value-stream map. For an eKanban project, this would involve documenting the flow of the current, manual Kanban process. (If you’re not using a manual Kanban system, map the current inventory replenishment process.) Next, document the process for the future state – using an eKanban system – and note the gaps. The goal is to identify the processes that do not provide value (e.g. waste) so they can be eliminated or improved upon.

    Take the time to ensure you’ve mapped out everything. It may seem tedious, but it is worthwhile. For example, in one facility I worked with, it took us a day to develop a good process map. Over the course of the exercise, we found multiple variations in the current, 66-step process that produced excess waste. For example, they were literally logging 7 miles a year to track down inventory! Once we streamlined our map and implemented the eKanban system, the process was trimmed to just 6 steps. The exercise exceeded expectations, providing all team members with quantifiable value of the project.

    document the process flow

    Before I move on, I want to take a moment to tie the value-stream mapping exercise to the key take-aways from the first blog in the series: Communication and buy-in. Those involved in developing the process maps will likely buy into its outcomes, hopefully becoming vocal advocates of the eKanban project. As in the example above, the mapping exercise also provides useful data points for leaders and others to communicate across the organization.

    Strategies for Getting Suppliers on Board

    Some manufacturers experience supplier resistance to a new electronic Kanban solution. This push-back may stem from the perception that they are being forced to adopt new technology, pay the price, and/or hold the risk.

    This criticism is based on the idea that when a supplier holds the inventory, they hold all the risk. One manufacturer I worked with had a unique solution to this dilemma. First, they started their eKanban implementation with a software pilot in a controlled area of their organization – and engaged just their top three suppliers. The manufacturer approached these three suppliers and entered into to a contract with them where they would assume half of the risk. Then they created a test environment where they could get the suppliers comfortable with the software. The suppliers received training on various scenarios, became familiar with email communications they would be receiving – and gained visibility into the supplier portal where they could monitor the manufacturer’s consumption and/or receive replenishment signals.

    Supplier engagement

    The manufacturer also gave their suppliers an incentive by including their eKanban software usage as part of their performance rating.

    By taking more of a partnership approach with their suppliers, the suppliers became more engaged and, in fact, found their own benefits in using the system. One of the suppliers, while finding the software easy to understand, liked the ability to monitor demand through the eKanban supplier portal. Another supplier who was initially concerned about having excess inventory, found the eKanban system allowed them to better level-load. As a result, they reduced their over-time costs and were able to increase capacity without added expense. A win-win for all.

    The Pilot Program and Beyond

    As was demonstrated in the use case above, a pilot (or vendor free trial) is not only helpful for suppliers, but for internal adoption and continuous improvement. Starting an eKanban implementation on an isolated line or work cell allows you to work out any kinks or issues before rolling out the software to other areas. Internal chatter about the system starts to take hold and, based on my experience, employees start hoping their area is next in line.

    Measuring manufacturing metrics

    Beyond the pilot program, it’s time to start measuring progress toward what you set out to accomplish – and the metrics that will influence those outcomes. The manufacturer in my example established metrics for baseline inventory reductions and increased inventory turns and were able to recoup their initial software investment before implementation was complete.

    Metrics typically associated with eKanban projects include:

    • Inventory turns/Inventory cost
    • Replenishment lead time
    • Stock buffer health
    • Supplier performance
    • Freight costs

    Improving these metrics often contribute to corporate-level goals of expense reduction, improved on-time delivery and greater throughput.

    Keep the Goals Top-of-Mind

    When executing a transformative process, ensure no one loses sight of the mission. Continually reinforce the value of the outcomes and regularly communicate progress toward goal attainment. This not only helps to set expectations as you roll out the project, but creates anticipation for its results.

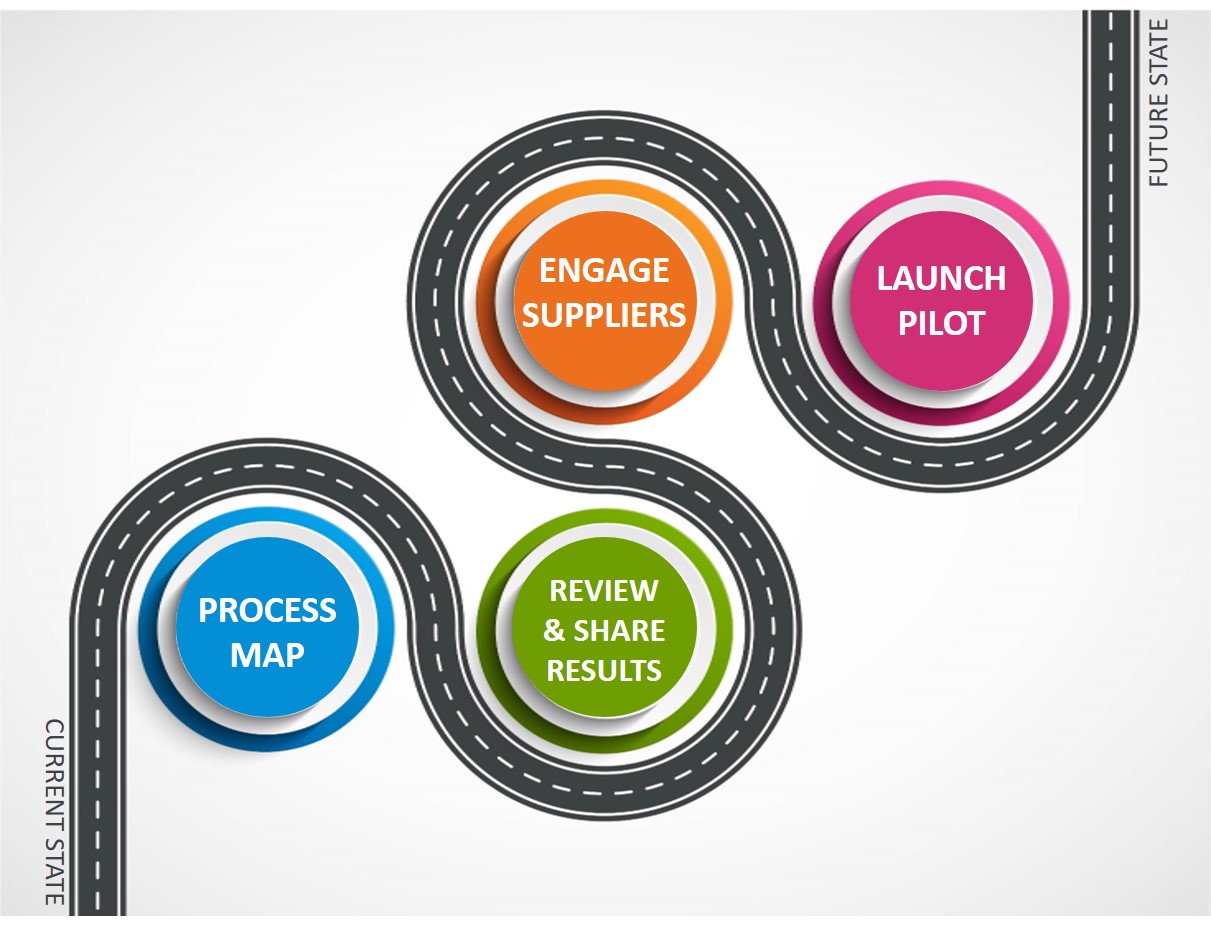
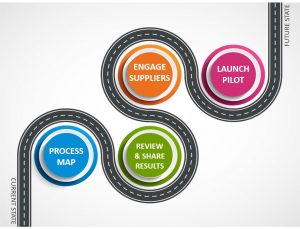
    In summary, for a successful eKanban project rollout, here are the steps I recommend:

    1. Map the current and future states of the process.
    2. Start focused – implement a pilot in a controlled area, make necessary adjustments and continue rolling out through a pragmatic approach.
    3. Partner with your suppliers to make the implementation a win-win.
    4. Monitor your metrics.

    As you think about eKanban – or similar Lean projects in your organization – I hope you find this insight helpful. Next time, I’ll address post-implementation strategies of “listening to the process” and focused continuous improvement.

    Jim Shore is the Principal of Quality Lean Solutions, a Consultant Firm that specializes in Medical Device companies, Supplier Quality and Lean Manufacturing principles.  Mr. Shore is co-author of “Proactive Supplier Management in the Medical Device Industry” (2016: Quality Press). Jim has 25 years of quality and supplier management experience in medical devices, semiconductor, aerospace and defense for firms and organizations including Titan Medical, Nypro Healthcare, Boston Scientific, Aspect Medical, Brooks Automation, Raytheon and ACMI Gyrus (now Olympus). He is Six Sigma Black Belt and Quality Manager/Operations Excellence-certified by the American Society for Quality (ASQ), as well as an ASQ-certified Quality Auditor and Mechanical Inspector. A veteran of Operation Desert Storm, he served in the U.S. Marine Corps for more than 15 years.


  • FAQ: What is the Difference Between Pull Manufacturing and Demand-Driven Manufacturing?

    FAQ: What is the Difference Between Pull Manufacturing and Demand-Driven Manufacturing?

    Pull and Demand-Driven Manufacturing


    I often talk about pull manufacturing and Demand-Driven Manufacturing as though they are one and the same. That’s because, in my mind, they are. However, after reading through a couple of online articles this afternoon, it’s clear not everyone sees it that way. In fact, some of the various ways pull manufacturing is described on the Internet can be a bit confusing.

    In pull manufacturing, replenishment of raw materials or components is triggered by downstream demand. For example, if an order for 100 widgets is released into the system, it will pull production through the system from raw materials orders all the way through to the finished goods.

    Demand orders signal replenishment

    There is an important distinction made by some writers between pull and Demand-Driven manufacturing: the demand signal. For me, the order for 100 widgets is triggered by demand from an end-customer in both pull- and Demand-Driven Manufacturing. Working backwards, 100 widgets are sold at retail, which in turn creates a replenishment order for 100 widgets at the distributor, which translates into an order for 100 widgets at the manufacturer.

    However, some proponents of pull manufacturing argue that the pull signal can also come from 100 widgets that will sit unsold on a shelf in the warehouse waiting for a customer order. Because production is being pulled from a demand signal downstream, it is still pull manufacturing even if it isn’t customer demand driven. This seems to me like putting a pull veneer on push thinking, and it can limit your ability to achieve your objectives because, even if you can reduce WIP inventory levels, you still run the risk of excess finished goods inventory and a lot of waste.

    safety stock for raw materials

    When I get to this point in the discussion with manufacturers who are new to Demand-Driven Manufacturing, they often ask a good question: Can I still have safety stock? For decades, we’ve been conditioned to setting safety stock levels for raw materials and key components. Doing without them can seem like performing a high-wire act without a net.


    Is There a Place for Safety Stock in a Demand-Driven World?

    In a perfect world, all production in Demand-Driven Manufacturing is triggered by an actual order, eliminating any excesses in raw materials, WIP inventory, or unsold finished goods. But, whoever said we live in a perfect world?

    Most Demand-Driven Manufacturers will still do some level of forecasting of demand, but it’s more for long-term planning than short-term production. Buffer stocks are also a feature of Demand-Driven Manufacturing, but it’s important to understand the difference between safety stock and buffer stock. The Lean Enterprise Institute describes it this way:

    “The terms buffer aLean principles - rocks and water nd safety stock often are used interchangeably, which creates confusion. There is an important difference between the two, which can be summarized as: Buffer stock protects your customer from you (the producer) in the event of an abrupt demand change; safety stock protects you from incapability in your upstream processes and your suppliers.”

    In other words, safety stock is excess inventory that is designed to cover inefficiencies in your production processes. If you’ve studied Lean principles, you probably remember the rocks and water example. The rocks are the problems in your factory such as scrapped production runs, long set up times, and unplanned downtime. Inventory is the water that covers these rocks so that they don’t impact your ability to serve your customers. This excess inventory removes the urgency to make long-term improvements, which means real improvements are seldom made and inventory levels remain excessively high.

    In Lean Manufacturing (and Demand-Driven Manufacturing) inventory should not be used to cover a problem. Instead the problem should be resolved. However, many Lean and Demand-Driven manufacturers will still use buffer stocks to protect their customers from variability in demand.

    For some real-world case studies highlighting the benefits of pull manufacturing/Demand-Driven Manufacturing as it was meant to be, we invite you to visit our web site.


  • Weathering the Next Recession

    Weathering the Next Recession

    manufacturing recovery

    The global economic recession that started in 2007/2008 hit the manufacturing sector hard. In February of 2009, The Economist even published a piece called The Collapse of Manufacturing. If you recall, this was right about the time the automotive manufacturer bailouts kicked in because they, like the larger financial institutions, were deemed too important to the US economy to fail. It felt like we were on the verge of an economic collapse.

    Whether they supported that bailout or not, most people recognized that it was a short-term solution to a long-term problem. The auto industry, like many other manufacturing sectors, was awash in excess capacity. When consumer demand dropped due to the recession, this excess capacity could no longer be ignored because it led to mountains of unsold inventory and raw materials sitting in the supply chain.

    Many companies didn’t survive the recession, at least not in their current state. In 2010, Harvard Business Review said that 17% of the companies they were following in a post-recession study had gone bankrupt, were acquired or went private. Opinion makers and pundits differ as to whether the recession actually ended in 2010, so that finding might have been a bit premature.

    Things are looking up

    While there are still plenty of naysayers who can find the cloud surrounding every silver lining, many economists agree that indicators are improving as we approach the end of 2017. The MAPI Foundation predicts a pretty substantial growth in manufacturing output at least through 2020.

    MAPI forecast

    As I write this, unemployment has fallen to 4.1%, a 17-year low, with manufacturing being one of the primary beneficiaries. According to MarketWatch, so far in 2017, manufacturing jobs have increased by 138,000 after falling by 34,000 in the first 10 months of 2016.

    Learning lessons from the past

    Let’s assume (and hope) these predictions are accurate and the positive trends continue. Now is not the time to get complacent. Unfortunately, recessions are like earthquakes. You know they will happen. You can even monitor for signs of an impending quake. But it is almost impossible to predict when and where they will strike and how much damage they will do. The MAPI Foundation’s growth in output levels off in 2020 because they are allowing for the possibility of another recession. They don’t go so far as to predict one, but they know it will eventually happen.

    Lessons from the pastClearly, pulling back and not investing in anything isn’t the answer. Instead, the key to surviving the next recession is to avoid making the same mistakes. Demand-Driven Manufacturing can help.

    Understand your true capacity – One of the key principles behind Demand-Driven Manufacturing is the Theory of Constraints (TOC). In TOC, there is always one resource that limits the factory’s ability to meet demand. For example, it might be a work station that has a constant backlog, impacting all downstream operations. In Demand-Driven Manufacturing, that constraint becomes the pacemaker for production, keeping work flowing at a constant rate, or load (e.g., CONLOAD) Watch this short demo of CONLOAD to see what that looks like.

    Many manufacturers using CONLOAD (part of SyncManufacturing) find that this process actually helps them to increase capacity; because constraints are managed, work continuously flows.

    Avoiding excess inventory – In Demand-Driven Manufacturing, production scheduling is based on actual orders; nothing is produced until it is needed. For example, a manufacturer may believe there is going to be an uptick in orders for a particular widget. They might even add capacity in terms of more modern equipment or higher-skilled operators. But that widget will not be produced until an order is actually received. Likewise, the components that go into the final product will not be produced either, lowering both finished goods and WIP inventory.

    Excess inventory

  • 3 Prerequisites to a Modern Demand-Driven Supply Chain

    3 Prerequisites to a Modern Demand-Driven Supply Chain

    In 2010, Gartner estimated that manufacturers outsourced about 70% of the products they make to other manufacturers. I haven’t seen a recent statistic, but that still feels about right.

    So, it only makes sense that, for most manufacturers, implementing modern demand-driven or pull-manufacturing techniques will require collaboration with many partners across the entire supply chain.

    Before you can collaborate with your supply chain partners, you need to get your own house in order. Here are three things you need to do:

    Efficiency vs. productivity in manufacturing#1 Digitize. The demand-driven supply chain runs on data—the right data in the hands of the right people at the right time. Before you can make this happen, you may need to address a few data issues in your own operations. It’s not unusual for us to work with companies that have two or three ERP systems, especially if they’ve grown through acquisition, in addition to several point solutions for things like maintenance, scheduling, time management and so on.

    For those of you who have been in the industry a while, the idea of a data standardization and consolidation project may send you reaching for the Tylenol bottle. You’ll be glad to know that with the right technology, you can get through this relatively headache-free. For example, we helped Orbital ATK, an aerospace manufacturer of custom composite parts, connect over 100 individual data sources to collect data from more than 61,000 tags. At a recent conference, Paul Hardy, Application Architect at Orbital ATK, gave a fascinating presentation on how they use this data to improve operations. You can access his talk on our YouTube page here.

    #2 Synchronize. The next prerequisite is to synchronize everything (people, processes, materials, machines and data) at the order level. If production flow isn’t aligned to customer orders inside your own facilities, you can’t deliver the right data to your supply chain partners.

    This synchronization alone can have a dramatic impact on performance. We worked with GIW Materials, a manufacturer of heavy-duty centrifugal slurry pumps, to help them lower cycle times and improve on-time performance. The crux of the solution was to optimize product flow and control cycle time by synchronizing everything to orders: pattern information, flasks, combination equipment, engineering revisions and capacity. The impact was so noticeable to their customers that GIW doubled their revenues in two and a half years. You can access their case study here.

    #3 Visualize. Once you’ve digitized your data and synchronized production flow to customer orders, you need to put the right data into the hands of the right people. These days, there is almost no limit to the amount of data we can collect. In the demand-driven supply chain, more is not necessarily better because you can easily overwhelm people. Here are the three areas where you should focus your efforts:

    manufacturing visualizationDemand and supply – visibility and synchronization of the demand signal, material and resource availability to drive uninterrupted production flow.

    Production flow indicators – visibility into stock buffer levels, constraints, shop floor events, etc.

    Priorities – adapting to demand and communicating changes across the supply chain.

    Pulling it all together

    If the products you manufacture are heavily reliant on outsourced components or services, you may not have the luxury of waiting long before you roll out your demand-driven manufacturing approach to the rest of your supply chain. This was the case with a microchip manufacturer we recently worked with.

    A growing part of this manufacturer’s business was to receive parts from OEMs and supply them to contract manufacturers. Both the OEMs and the contract manufacturers gave the manufacturer forecasts, but the formats were different, and like all forecasts, not always reliable. As a result, they were constantly in reactive mode, manually standardizing data from multiple sources in spreadsheets while juggling variances in supply and demand. We worked with them to consolidate the data into a single screen view that showed real-time, aggregated replenishment, inventory, and order status information. We also created a platform that allowed them to provide similar views to their OEM and contract manufacturing partners.

    Related resource: White paper: E2E Supply Chain Visibility Technology is Here


  • A New Way of Looking at Manufacturing Metrics

    A New Way of Looking at Manufacturing Metrics

    Modern Manufacturing Metrics

    Most experts agree. The metrics you use to manage your manufacturing operations need to matter, and they need to be actionable. We concur. For a detailed review of the operational metrics we recommend in a demand-driven manufacturing environment, refer to our Metrics for Action Guide.

    Conventional wisdom also says to keep the number of metrics you measure to a minimum. This advice is based on well-established research that shows that the human brain just can’t focus on more than five to seven things at a time. Trying to measure too many things at once has long been a recipe for never getting anything done.

    Besides, many manufacturers are still calculating metrics by hand (or spreadsheet) from information that is gathered manually, often with considerable effort. By the time they get the information they’re looking for, it’s already obsolete. Measuring more than a select handful of metrics may not be realistic.

    But, maybe it’s time to take another look at the way we think about metrics in manufacturing.

    It’s time to let go of conventional wisdom.

    Today’s technologies have solved the problem of outdated data. Metrics can be calculated in real-time and refreshed almost instantly. Tools are even available to gather data from the most antiquated of ERP systems, standardize it, and combine it with data from the increasingly extensive sources enabling the Internet of Things (IoT) that exist in almost every manufacturing environment.

    Technology also gives you the power to create a set of role-specific metrics that are accessible through dashboards from any device. A plant floor manager can see the metrics that matter at the plant level in Peoria using a tablet, while the COO can see the metrics that matter across the entire operations using a smartphone while waiting for a flight in Singapore.

    Modern Manufacturing MetricsModern technology collects and analyzes data from multiple sources, providing real-time visibility to metrics you can quickly take action on to improve.

    Of course, technology hasn’t yet changed our ability to concentrate on more than half a dozen things at once. (Regardless of how much we may try.) However, with the right applications, we don’t need to.

    For example, plant floor managers no longer need to comb through every metric and compare it to acceptable norms or historical data to identify problem areas. Nor do they need to walk the plant floor hoping to spot possible problems, which savvy factory workers are often adept at covering up. With the right software, dashboards can be as sophisticated as a visual representation of the shop floor with color-coded indicators showing problem areas. The plant manager can measure metrics like queue turns at every single workstation in their domain, but they only need to pay attention to those workstations where queue turns are outside of the acceptable range.

    SyncView plant visualization

    Plant level view with indicators showing the status of key metrics at each workstation.

    We’re not suggesting you go wild with managing metrics. Remember, they still need to matter, and in demand-driven manufacturing, there are generally fewer metrics that do. However, we are saying that if there is a metric that matters to you, why be held back by conventional wisdom from the 20th century?

    To learn more about how technology can help you manage – and visualize – the metrics that matter, join us online for our on-demand webinar Visualizing Metrics in the Factory of the Future.


“test”