 We have so much real-time data around us in our daily routines. A barista starts to prepare my order the moment that I purchase my daily coffee. I instantly know how close I am to the speed limit thanks to my car’s speedometer. And I see an accurate count down of the number of minutes before my computer turns off due to a drained battery. Since all of this real-time data is available in our day-to-day lives, shouldn’t we expect the same for data we use in our manufacturing organizations?
Countless times I have walked into customer sites on Day 1 and seen old data everywhere. I have seen four walls of a conference room covered with 8 ½” by 11” printed reports, most of which were multiple weeks old. Or users that explain that they perform analysis based off of desktop spreadsheet files, with manual data loads. In each of these cases, people are operating off of old data, even if it was updated just a few hours ago. If my speedometer had that same delay, I would have a lot more speeding tickets!
Old Data is Just… Old Data
Manufacturers today are asking themselves how they can do better and be better. They realize that to be competitive, they should look inside the factory first and explore their own processes to find areas for improvement. If they analyze their data to see what it shows about their operations, they tend think that any data to go off of is better than no data, right? Not always, I say.
Based on how fast your environment changes, it could be detrimental to make decisions off of old data. Since the pace of business has increased for manufacturers, thanks to both technology and complexity, so too should the pace at which data is collected and made available to make informed decisions. For example, consider everything that can happen in the span of an hour:
- Purchasing finds out that a truck shipment of raw materials will be delayed two days due to weather.
- A new customer puts in a rush online order double the size of previous months.
- Maintenance begins fixing a problem on a constraint resource that is estimated to take at least a couple of hours.
Wouldn’t your organization want to know about all of these situations as soon as it could? Certainly. Keep in mind, however, that as more and more data is available, you’ll need to discern if, when, and how you take action. That is, you’ll need to separate knowing that events occur versus reacting to them right away. Each event could immediately impact your organization’s priorities, but you also don’t want to be jumpy and let every event disrupt your overall process. The important thing is that you are aware and that you have the right information at hand to make necessary decisions.
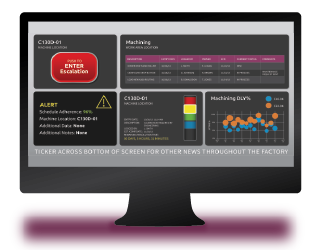
Better yet, your systems can also be aware of this same event data and alert you only to the issues that require your intervention. Technology solutions for manufacturers should be able to take real-time data, assess it against other conditions and values, and then notify you to respond only to the events that need your attention. This is the nature of demand-driven manufacturing – since the focus is on overall production flow, you only need to address those issues that disrupt flow. The rest is probably just normal “noise” – or what becomes a normal day for a manufacturer.
Manual Reporting Makes Data Stale
So how did we get to the point where so many manufacturers are not using real-time information? Thankfully, manufacturing technology is catching up to provide all of the information and analytics that companies seek in an automated, real-time manner. Organizations have always had the desire for information and reports, but they’ve commonly only had manual methods as options. Consider the volume of reporting that a typical manufacturing company does on a recurring basis – that’s a lot of manual reporting happening based on non-real time data. Think of the time drain that both the manual data collection and report running put on a company. If it takes an analyst only two hours to run a report, that means they are already using information that’s at least two hours old.
If you run reports on yesterday’s manually collected data, then you will only have information about yesterday. Further, we will still need a clear, straightforward way to display that information to users. I know my car’s current speed based on the easy-to-read dashboard, for example. If we demand that our organizations collect real-time data – and we have a tool like a visual factory system to display this information – then we have a powerful platform from which to understand what is happening today and what to prepare for tomorrow within operations. In the next blog, we will pick up on this topic of how to use historical data in a meaningful way, but in the meantime, send me your comments and questions.