 Three Ways Leaders Create Lean
“Relentless” leadership and team empowerment drive lean change
For those of you who have heard this before, it bears repeating. For those of you who have not, this is important – leadership is the single most important component to lean success.
It is exciting to talk about bottom-up change and expect that a ground swell of individuals in virtually every level of the organizational chart can succeed with lean—in spite of those in the C-suite that just don’t get it. But in practice, this has to happen early on or there is little-to-no chance of success.
Who’s driving this thing?
I am not saying that lean changes cannot start from the bottom-up; but the situation needs to flip quickly to leadership driving the bus. That’s because at some point early on in your lean journey, your methods will start to conflict with some long-standing processes and metrics. These formerly sacrosanct topics need to be addressed by leadership (those with the power to change them) before your journey can continue.
Once leadership is on board, the leader(s) can come from anywhere in the company. But to prevent stagnation at a higher level, leaders must carry the torch of continuous improvement tirelessly and relentlessly.
80/20 rule
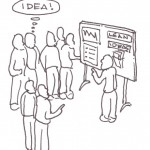
They can start out leading the kaizen events but they need to mentor and train those doing the work in order to keep continuous improvement alive and well. Mature lean organizations expect 80% of their improvements to come directly from those closest to the work. This is the only way to fully utilize the talents and capabilities of your human assets. Give the people closest to the work the tools and the support necessary to astound you with their creativity and innovation.
Out on the floor
Gone are the days where leaders sit in their offices sending out directives to the rest of the organization and lead mainly by pounding on the rest of us when those directives are not met. Today, leaders are responsible for training and mentoring their people. They equip them with the tools of continuous improvement and empower them to remove the obstacles that block their way. Here are some ways I have seen manufacturing leadership create a more demand-driven culture:
- Of machines and men (or women) – Leaders who think of their production staff as extensions of their equipment are making a fatal error. Empowered people who feel their bosses care about keeping them on staff by growing their skills and offering development opportunities are the people who will drive the changes needed to make your business excel.
- “Scaffolding” support – It is a huge mistake to treat your people like their only role is to follow the standard operating procedures (SOPs) handed down from above and that the only way they drive value is when their direct labor hours are being absorbed into products. You are under-utilizing the most valuable assets in your organization. It doesn’t happen overnight and without any effort, but you must build the scaffolding needed to support your people by giving them the tools, confidence, and authority to make changes. It is the people closest to the work – and who know the most about the process – that can provide the greatest innovation if you build the foundation on which they can innovate.
- Training rolls on- Training should never stop. I hear the complaints and the unending list of obstacles – no time, no budget, where to begin, no senior-level support, and so on. But every moment spent training your people yields ongoing hours saved in fixing mistakes, putting out fires and trying to explain your poor results to the powers that be. Equip them with the tools, confidence, and abilities to speak up when something’s wrong; show them how to look for solutions and take ownership of results, and you are tuning up the “true improvement machine” on your shop floor and beyond.
I have been working with supply chain professionals and manufacturing leaders my entire career. If there is one thing I can say about the successful ones, it’s this: Effective change agents in manufacturing environments invariably spring from a leadership culture that supports the people not just the change — every step of the way.
– John Maher
 Manufacturers use constraints management first to gain the most demand-driven change